Answered step by step
Verified Expert Solution
Link Copied!

Question

1 Approved Answer

Return to question 3 Required information Part 2 of 2 Problem 13-2A Ratios, common-size statements, and trend percents LO P1, P2, P3 [The following information

image text in transcribedimage text in transcribedimage text in transcribed

Return to question 3 Required information Part 2 of 2 Problem 13-2A Ratios, common-size statements, and trend percents LO P1, P2, P3 [The following information applies to the questions displayed below.) 4 points Selected comparative financial statements of Korbin Company follow: KORBIN COMPANY Comparative Income Statements For Years Ended December 31, 2017, 2016, and 2015 2017 2016 2015 Sales $ 406, 296 $ 311,256 $ 216,000 Cost of goods sold 244,590 195,469 138,240 Gross profit 161,706 115,787 77,760 Selling expenses 57,694 42,953 28,512 Administrative expenses 36,567 27,391 17,928 Total expenses 94,261 70,344 46,440 Income before taxes 67,445 45,443 31,320 Income taxes 12,545 9,316 6,358 Net income $ 54,900 36,127 $ 24,962 Check my work mode : This shows what is correct or incorrect for the work you have completed so far. It does not indicate completion. Return to question 3 KORBIN COMPANY Comparative Balance Sheets December 31, 2017, 2016, and 2015 Part 2 of 2 par 2012 2017 2016 2015 $ 51,775 4 points 96,153 $ 147,928 $ 40,508 600 102,536 $ 143,644 $ 54,149 4,880 59,980 $ 119,009 Assets Current assets Long-term investments Plant assets, net Total assets Liabilities and Equity Current liabilities Common stock Other paid-in capital Retained earnings Total liabilities and equity $ 21,597 71,000 8,875 46,456 $ 147,928 $ 21,403 71,000 8,875 42,366 $ 143,644 $ 20,827 53,000 5,889 39,293 $ 119,009 Problem 13-2A Part 2 2. Complete the below table to calculate income statement data in common-size percents. (Round your percentage answers to 2 decimal places.) Return to question 3 Required information Part 2 of 2 Answer is complete but not entirely correct. Pat 2012 4 points 2015 KORBIN COMPANY Common-Size Comparative Income Statements For Years Ended December 31, 2017, 2016, and 2015 2017 2016 Sales 406,296.00 X % 311,256.00 X % Cost of goods sold 244,590.00 X 195,469.00 X Gross profit 161,706.00 115,787.00 Selling expenses 57,694.00 X 42,953.00 Administrative 36,567.00 27,391.00 expenses Total expenses 94,261.00 70,344.00 Income before taxes 67,445.00 X 45,443.00 X Income taxes 12,545.00 9,316.00 X Net income 54,900.00 % 36,127.00 % 216,000.00 % 138,240.00 77,760.00 28,512.00 X 17,928.00 X 46,440.00 31,320.00 6,358.00 X 24,962.00 %

Step by Step Solution

There are 3 Steps involved in it

Step: 1

blur-text-image

Get Instant Access to Expert-Tailored Solutions

See step-by-step solutions with expert insights and AI powered tools for academic success

Step: 2

blur-text-image

Step: 3

blur-text-image

Ace Your Homework with AI

Get the answers you need in no time with our AI-driven, step-by-step assistance

Get Started

Recommended Textbook for

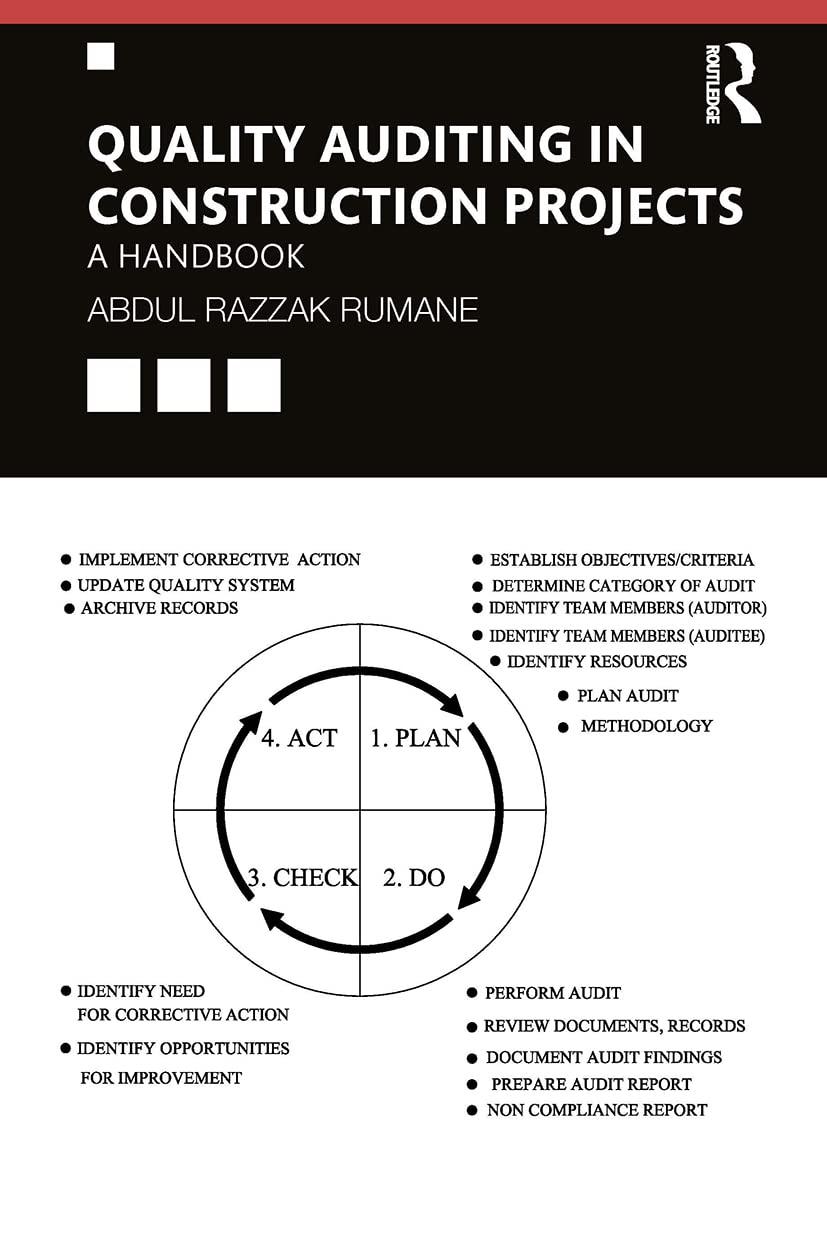
Quality Auditing In Construction Projects

Authors: Abdul Razzak Rumane

1st Edition

1032570245, 978-1032570242

More Books

Students also viewed these Accounting questions

Question

Draw a heart and label the chambers and valves.

Answered: 1 week ago

Question

1. Briefly describe the five components of emotions.

Answered: 1 week ago

Question

Perform an Internet search. Discuss a company that uses EPLI.

Answered: 1 week ago

Question

How do you feel about employment-at-will policies? Are they fair?

Answered: 1 week ago