Answered step by step
Verified Expert Solution
Link Copied!

Question

1 Approved Answer

Revenue and expense data for Young Technologies Inc. are as follows: Year 2 Year 1 Sales $500,000 325,000 70,000 Cost of goods sold Selling expense

image text in transcribed
Revenue and expense data for Young Technologies Inc. are as follows: Year 2 Year 1 Sales $500,000 325,000 70,000 Cost of goods sold Selling expense Administrative expenses Income tax expense $440,000 242,000 79,200 70,400 75,000 10,500 16,400 Required: a. Prepare an income statement in comparative form, stating each item for both years as an amount and as a percent of sales. Round percentage amounts to nearest whole percent. Young Technologies Inc. Comparative Income Statement For the Years Ended December 31, Year 2 and Year 1 Year 2 Amount Year 2 Percent Year 1 Amount Year 1 Percent 96 % % 96 96 % Total expenses b. Comment on the significant changes disclosed by the comparative income statement The vertical analysis indicates that the cost of goods sold as a percent of sales administrative expense as a percentage of sales and income tax expense of sales between the two years. Selling and Overall net income as a percent

Step by Step Solution

There are 3 Steps involved in it

Step: 1

blur-text-image

Get Instant Access to Expert-Tailored Solutions

See step-by-step solutions with expert insights and AI powered tools for academic success

Step: 2

blur-text-image

Step: 3

blur-text-image

Ace Your Homework with AI

Get the answers you need in no time with our AI-driven, step-by-step assistance

Get Started

Recommended Textbook for

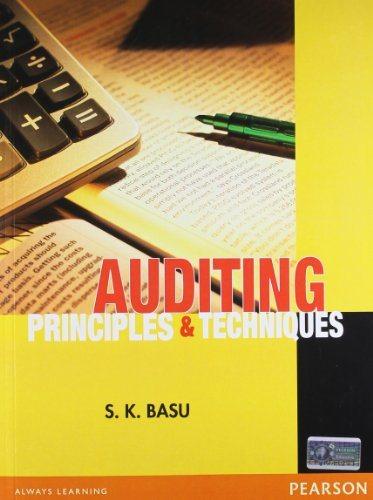
Auditing Principles And Techniques

Authors: Sanjib Kumar Basu, Andrei Alexandrescu

1st Edition

8177581783, 9788177581782

More Books

Students also viewed these Accounting questions

Question

Record materials received on materials ledger cards. LO.1

Answered: 1 week ago

Question

c. What groups were least represented? Why do you think this is so?

Answered: 1 week ago