Answered step by step
Verified Expert Solution
Question
1 Approved Answer
Revenue Cost of revenue Gross profit Operating expenses Research and development Sales, general and administrative Acquisition termination cost Total operating expenses Operating income Interest

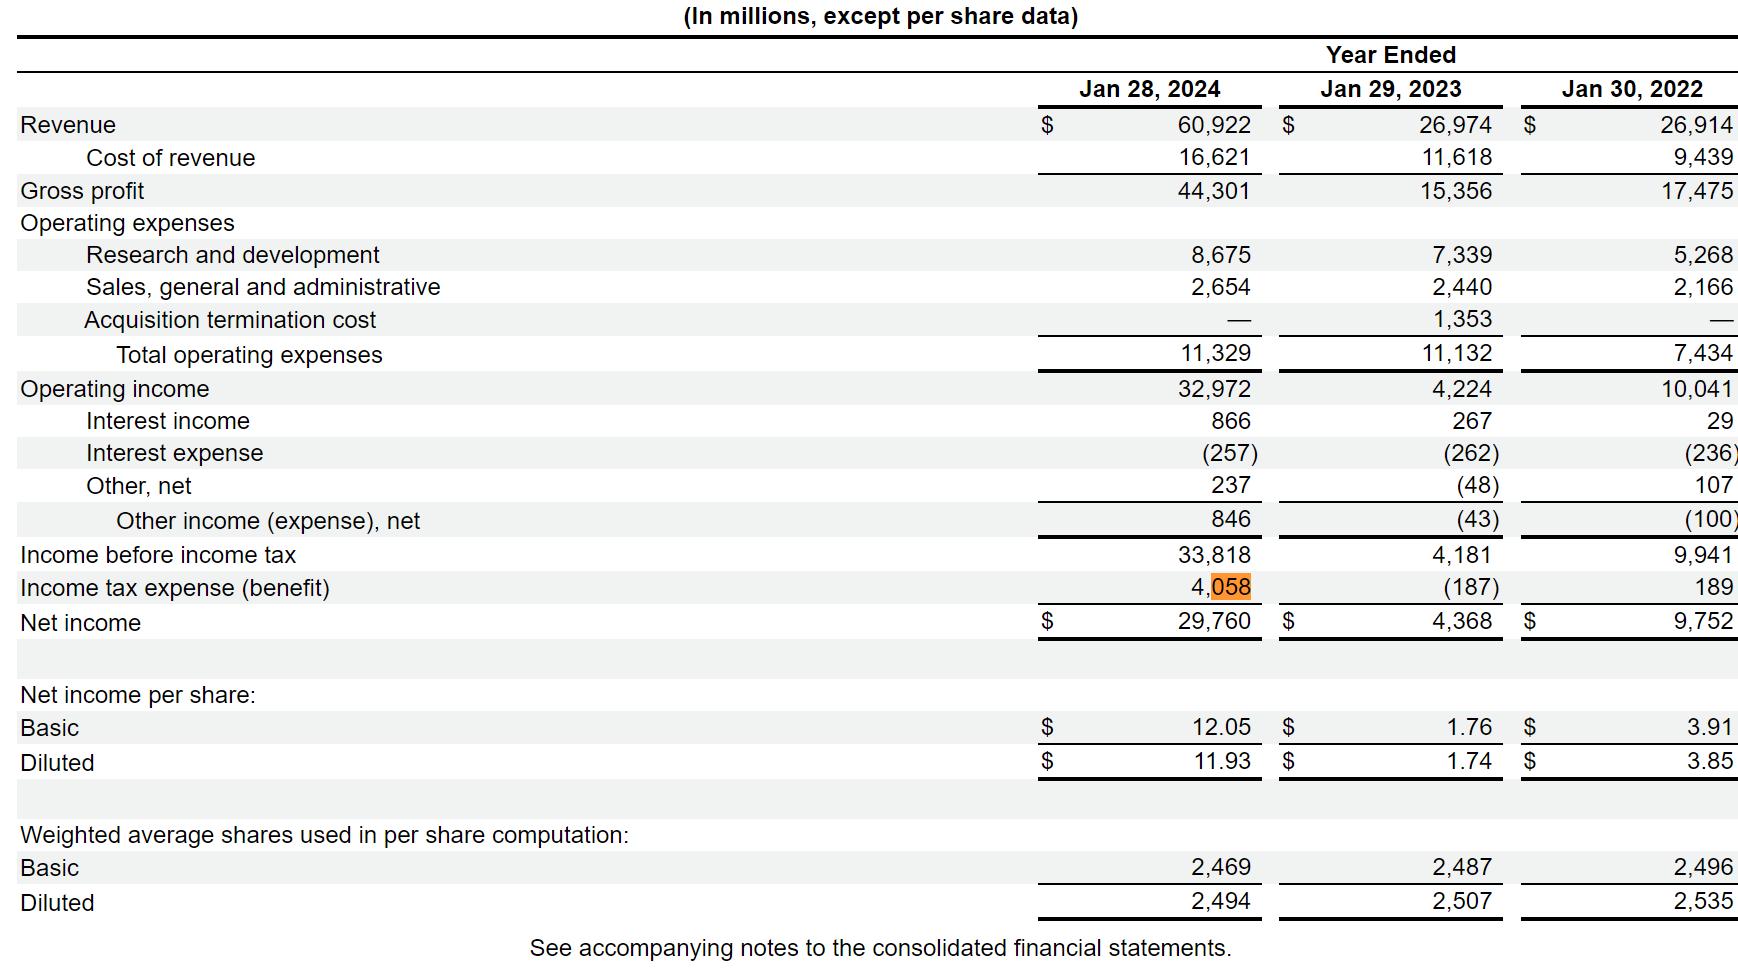
Revenue Cost of revenue Gross profit Operating expenses Research and development Sales, general and administrative Acquisition termination cost Total operating expenses Operating income Interest income Interest expense Other, net Other income (expense), net Income before income tax Income tax expense (benefit) Net income Net income per share: Basic Diluted Weighted average shares used in per share computation: Basic Diluted (In millions, except per share data) Year Ended Jan 28, 2024 Jan 29, 2023 Jan 30, 2022 $ 60,922 $ 26,974 $ 26,914 16,621 11,618 9,439 44,301 15,356 17,475 8,675 7,339 5,268 2,654 2,440 2,166 1,353 11,329 11,132 7,434 32,972 4,224 10,041 866 267 29 (257) (262) (236) 237 (48) 107 846 (43) (100) 33,818 4,181 9,941 4,058 (187) 189 $ 29,760 $ 4,368 $ 9,752 SS $ 12.05 $ 1.76 $ 3.91 $ 11.93 $ 1.74 $ 3.85 2,469 2,487 2,496 2,494 2,507 2,535 See accompanying notes to the consolidated financial statements.
Step by Step Solution
There are 3 Steps involved in it
Step: 1
The image you sent is a table that shows the income statement of a company for the fiscal years ended Jan 28 2024 Jan 29 2023 and Jan 30 2022 Heres a breakdown of the revenue and expenses for the year ...
Get Instant Access to Expert-Tailored Solutions
See step-by-step solutions with expert insights and AI powered tools for academic success
Step: 2

Step: 3

Ace Your Homework with AI
Get the answers you need in no time with our AI-driven, step-by-step assistance
Get Started


