- Review Chapter 14 including Appendix 14A in your textbook.
- Use the cash budget example in Appendix 14a of your textbook to answer the following questions.
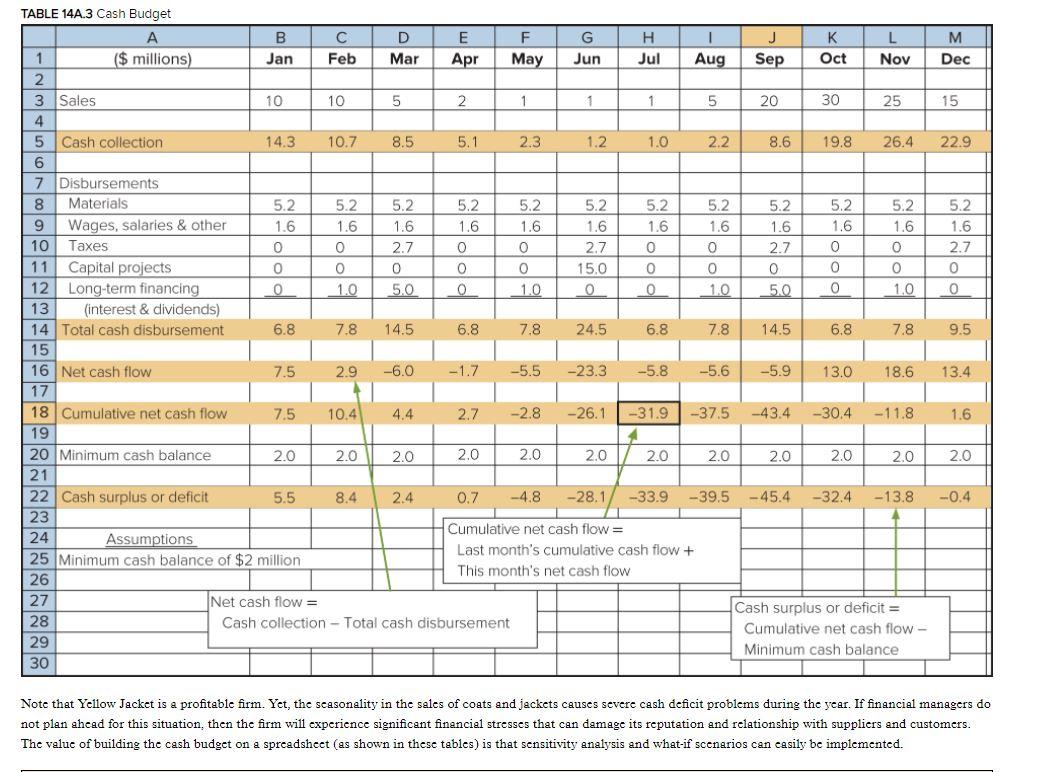
- Why does the Yellow Jack company show a deficit cash flow for the year but is a profitable company?
-
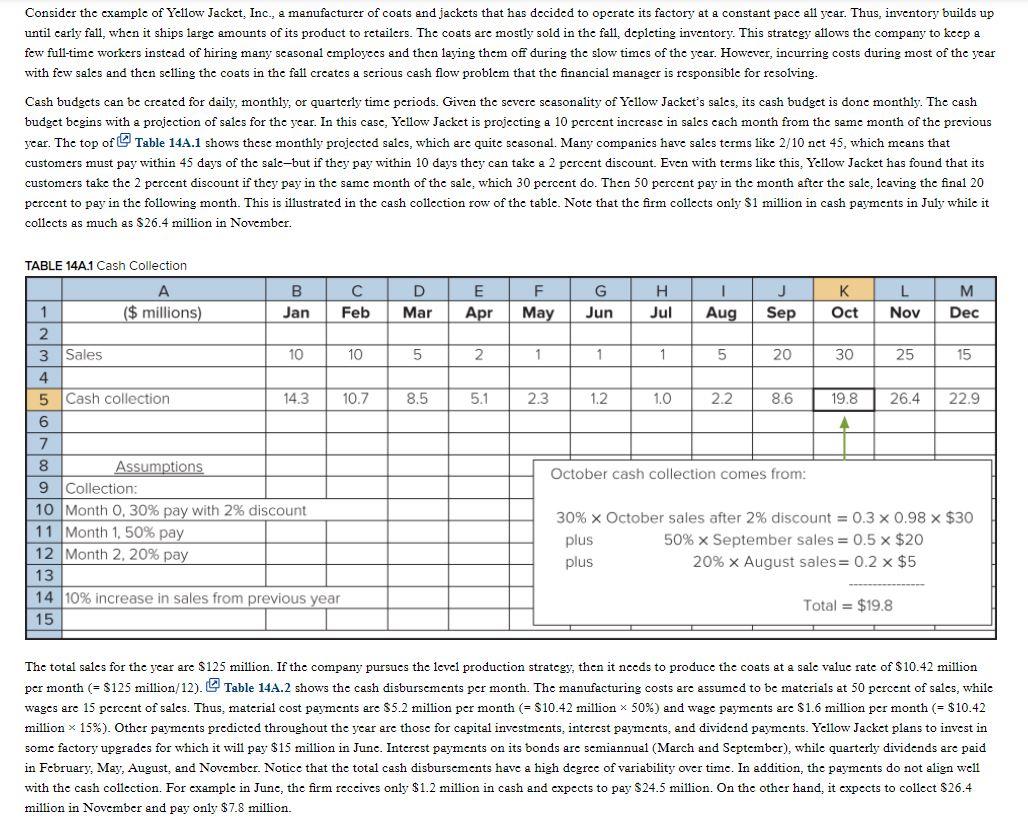
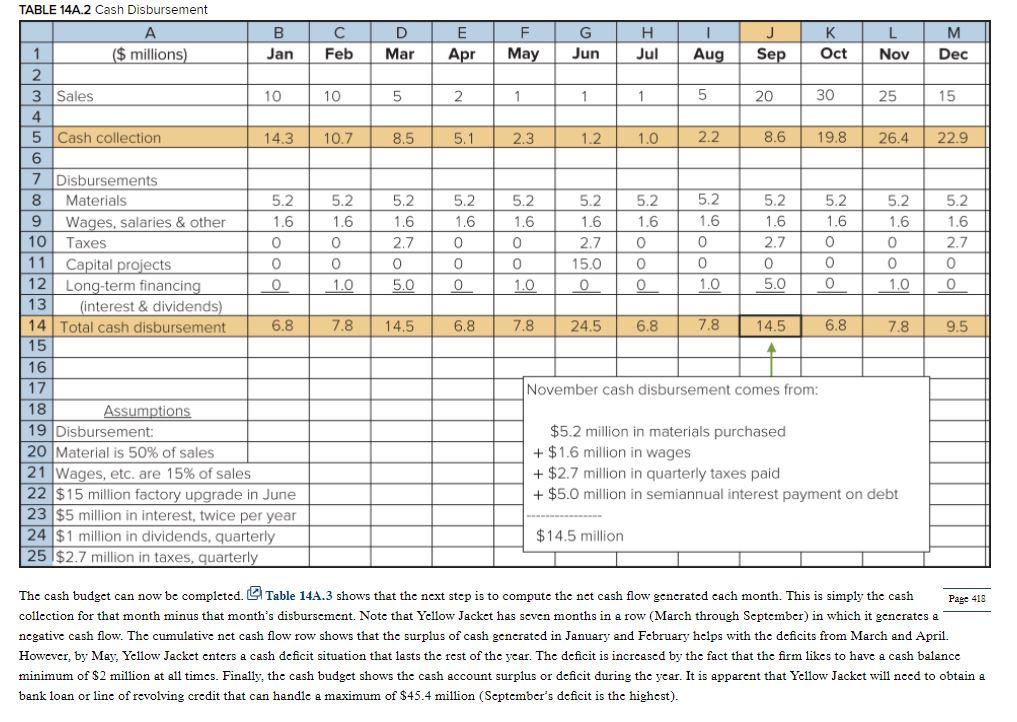
Consider the example of Yellow Jacket, Inc., a manufacturer of coats and Jackets that has decided to operate its factory at a constant pace all year. Thus, inventory builds up untii carly fall, when it ships large amounts of its product to retailers. The coats are mostly sold in the fall, depleting inventory. This strategy allows the company to keep a few full-time workers instead of hiring many seasonal employees and then laying them off during the slow times of the year. However, incurring costs during most of the year with few sales and then selling the coats in the fall creates a serious cash flow problem that the financial manager is responsible for resolving. Cash budgets can be created for daily, monthly, or quarterly time periods. Given the severe scasonality of Yellow Jacket's sales, its cash budget is done monthly. The cash budget begins with a projection of sales for the year. In this case, Yellow Jacket is projecting a 10 percent increase in sales cach month from the same month of the previous year. The top of Table 14A.1 shows these monthly projected sales, which are quite seasonal. Many companies have sales terms like 2/10 net 45, which means that customers must pay within 45 days of the sale-but if they pay within 10 days they can take a 2 percent discount. Even with terms like this, Yellow Jacket has found that its customers take the 2 percent discount if they pay in the same month of the sale, which 30 percent do. Then 50 percent pay in the month after the sale, leaving the final 20 percent to pay in the following month. This is illustrated in the cash collection row of the table. Note that the firm collects only $1 million in cash payments in July while it collects as much as $26.4 million in November. TABLE 14A.1 Cash Collection ($ millions) B Jan C Feb D Mar E Apr F May G Jun H Jul I Aug J Sep K Oct L Nov M Dec 1 2 3 Sales 10 10 5 2 1 1 1 5 20 30 25 15 4 5 6 Cash collection 14.3 10.7 8.5 5.1 2.3 1.2 1.0 2.2 8.6 19.8 26.4 22.9 A October cash collection comes from: 7 8 Assumptions 9 Collection: 10 Month 0. 30% pay with 2% discount 11 Month 1.50% pay 12 Month 2, 20% pay 13 14 10% increase in sales from previous year 15 30% x October sales after 2% discount = 0.3 x 0.98 x $30 plus 50% x September sales = 0.5 x $20 plus 20% x August sales= 0.2 x $5 Total = $19.8 The total sales for the year are $125 million. If the company pursues the level production strategy, then it needs to produce the coats at a sale value rate of $10.42 million per month (= $125 million 12). Table 14A.2 shows the cash disbursements per month. The manufacturing costs are assumed to be materials at 50 percent of sales, while wages are 15 percent of sales. Thus, material cost payments are $5.2 million per month (= $10.42 million