

Question
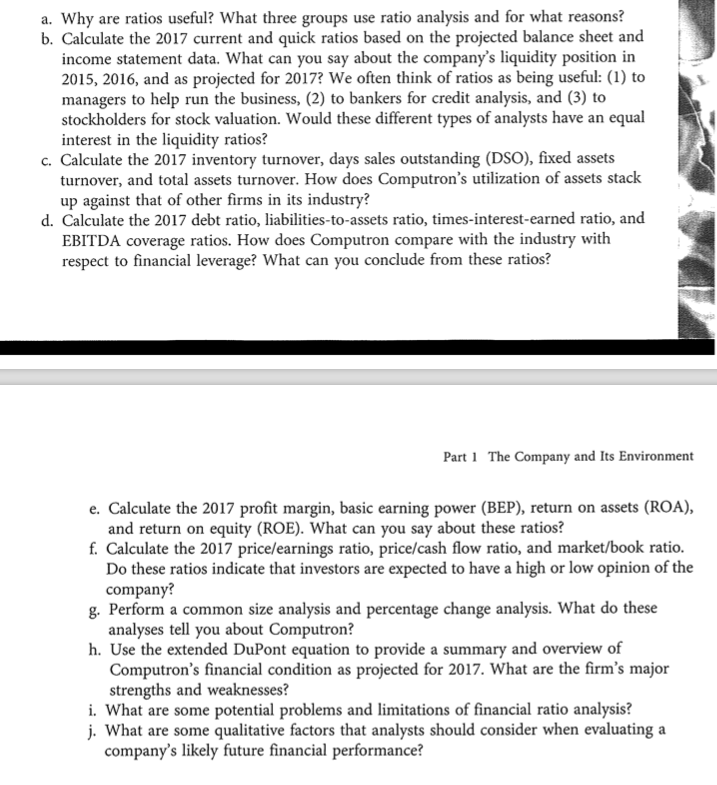
Review the requirements of the Chapter 3 Mini-Case, parts b through j. Then apply those requirements to do an analysis of Brinker International, which is
Review the requirements of the Chapter 3 Mini-Case, parts b through j. Then apply those requirements to do an analysis of Brinker International, which is a real company. Don't complete the minicase itself, just Brinker. Do the analysis on the basis of the figures for the most recent year. For part g, use the 2 most recent years. Download 10K financial statements for the most recent year for Brinker. A good source is the company's home page. Also compare the Brinker ratios to the industry averages and comment on significant differences. You'll note that some of the company's ratios you calculate won't agree with those found on the web page. Ratios are calculated in different ways, however, you should use the formulas in the text. Also, you won't find all of the industry averages, but you will find most of them. You'll need the company's stock price for several of the ratios; use the fiscal year end price. The company's stock symbol is EAT. http://www.brinker.com
| Brinker International, Inc. | |||||
| Fiscal Years | |||||
| Income Statement | 2017 | 2016 | 2015 | 2014 | 2013 |
| Revenues: | |||||
| Company Sales | $3,062,579 | $3,166,659 | $2,904,746 | $2,823,069 | $2,766,618 |
| Franchise and other revanues | 88,258 | 90,830 | 97,532 | 86,426 | 83,100 |
| Total revanues | 3,150,837 | 3,257,489 | 3,002,278 | 2,909,495 | 2,849,718 |
| Operating Costs and Expenses | |||||
| Company resturants | |||||
| Cost of sales | 791,321 | 840,204 | 775,063 | 758,028 | 758,377 |
| Resturant Labor | 1,017,945 | 1,036,005 | 929,206 | 905,589 | 892,413 |
| Resturant expenses | 773,510 | 762,663 | 703,334 | 686,314 | 658,834 |
| Company resturant expenses | 2,582,776 | 2,638,872 | 2,407,603 | 2,349,931 | 2,309,624 |
| Depreciation and amortization | 156,409 | 156,368 | 145,242 | 136,081 | 131,481 |
| General and administrative | 132,819 | 127,593 | 133,476 | 32,094 | 134,538 |
| Other gains and charges | 22,655 | 17,180 | 4,764 | 49,224 | 17,300 |
| Total operating costs and expenses | 2,894,659 | 2,940,013 | 2,691,085 | 2,567,330 | 2,592,943 |
| Operating Income | 256,178 | 317,476 | 311,202 | 242,165 | 256,775 |
| Interest Expense | 49,547 | 32,574 | 29,006 | 28,091 | 29,118 |
| Other, net | (1,877) | (1,485) | (2,081) | (2,214) | (2,658) |
| Income before provision for income tax | 208,508 | 286,387 | 284,277 | 216,288 | 230,315 |
| Privision for Income taxes | 57,685 | 85,767 | 89,618 | 62,249 | 66,956 |
| Net income | $150,823 | $200,620 | $194,659 | $154,039 | $163,359 |
| Basic net income per share | $2.98 | $3.47 | $3.09 | $2.33 | $2.28 |
| Diluted net income per share | $2.94 | $3.42 | $3.02 | $2.26 | $2.20 |
| Basic weighted averages shares outstanding | 60,638 | 57,895 | 63,072 | 66,251 | 71,788 |
| Diluted weighted average shares outstanding | 51,250 | 58,684 | 64,404 | 68,152 | 74,158 |
| Balance Sheet Data | |||||
| Working capital | ($292,036.00) | ($257,209.00) | ($233,304.00) | ($271,426.00) | ($191,796.00) |
| Total assets | 1,413,700 | 1,458,450 | 1,421,450 | 1,485,612 | 1,444,762 |
| Long-term obligations | 1,460,953 | 1,248,375 | 1,091,734 | 956,408 | 905,018 |
| Shareholders' equity | (493,681) | (225,576) | (90,812) | 63,094 | 149,357 |
| Dividends per share | $1.36 | $1.28 | $1.12 | $0.96 | $0.80 |
| Number of Resturants Open (EoY) | |||||
| Company-Owned | 1,003 | 1,001 | 888 | 884 | 877 |
| Franchise | 671 | 659 | 741 | 731 | 714 |
| Total | 1,674 | 1,660 | 1,629 | 1,615 | 1,591 |
| Revanues of Franchisees | $1,331,908 | $1,348,616 | $1,644,015 | $1,616,747 | $1,632,076 |
| Brinker International, Inc. | |||||
| Fiscal Years | |||||
| Balance Sheet | 2017 | 2016 | |||
| Assets | |||||
| Current Assets | |||||
| Cash, Cash equivalents | $9,064 | $31,446 | |||
| Accounts receiveable, net | 44,658 | 45,612 | |||
| Inventories | 24,997 | 25,104 | |||
| Resturant Supplies | 46,380 | 45,455 | |||
| Prepaid Expenses | 29,293 | 30,825 | |||
| Total Current assets | 154,392 | 178,442 | |||
| Property and equipment | |||||
| Land | 149,098 | 147,626 | |||
| Buildings and leasehold | 1,655,227 | 1,626,924 | |||
| Furniture and equipment | 713,228 | 663,472 | |||
| Construction in progress | 21,767 | 23,965 | |||
| 2,539,320 | 2,461,987 | ||||
| Less accumulated depreciation and amoritization | (1,538,706) | (1,418,835) | |||
| Net property and equipment | 1,000,614 | 1,043,152 | |||
| Other Assets: | |||||
| Goodwill | 163,953 | 164,007 | |||
| Deferred income taxes | 37,029 | 14,325 | |||
| Intangibles | 27,512 | 30,225 | |||
| Other Assets: | 30,200 | 28,299 | |||
| Total other assets | 258,694 | 236,856 | |||
| Total assets | $1,413,700 | $1,458,450 | |||
| Liabilities and Shareholders Deficit | |||||
| Current Liabilities | |||||
| Current Installments of long-term debt | $9,649 | $3,563 | |||
| Accounts Payable | 104,231 | 95,414 | |||
| Gift Card liability | 126,482 | 122,329 | |||
| Accrued Payroll | 70,281 | 70,999 | |||
| Other accrued liabilities | 121,582 | 121,324 | |||
| Income tax payable | 14,203 | 22,022 | |||
| Total current liabilities | 446,428 | 435,651 | |||
| Long-term debt, less current installments | 1,319,829 | 1,110,693 | |||
| Other liabilities | 141,124 | 137,682 | |||
| Commitments and Contingencies | |||||
| Shareholders Deficit | 17,625 | 17,625 | |||
| Common Stock (see notes_ | 502,074 | 495,110 | |||
| Additional paid-in capital | (11,921) | (11,594) | |||
| Accumulated other comprehensive loss | 2,627,073 | 2,545,716 | |||
| Retained earnings | 3,134,851 | 3,046,857 | |||
| Less tresuray stock, at cost | (3,628,532) | (3,272,433) | |||
| total shareholders deficit | (493,681) | (225,576) | |||
| Total liabilites and shareholders' deficit | $1,413,700 | $1,458,450 | |||
Step by Step Solution
There are 3 Steps involved in it
Step: 1

Get Instant Access to Expert-Tailored Solutions
See step-by-step solutions with expert insights and AI powered tools for academic success
Step: 2

Step: 3
Ace Your Homework with AI
Get the answers you need in no time with our AI-driven, step-by-step assistance
Get Started
Fundamentals Of Financial Management
Authors: James Van Horne, John Wachowicz
13th Revised Edition
978-0273713630, 273713639