Question
Risk and Rates of Return: Stand-Alone Risk Stand-alone risk is the risk an investor would face if he or she held only . No investment
Risk and Rates of Return: Stand-Alone Risk
Stand-alone risk is the risk an investor would face if he or she held only  . No investment should be undertaken unless its expected rate of return is high enough to compensate for its perceived
 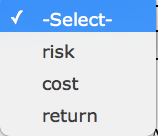 . The expected rate of return is the return expected to be realized from an investment; it is calculated as the
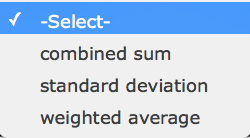 of the probability distribution of possible results as shown below:

The 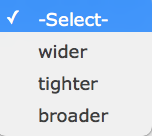 an asset's probability distribution, the lower its risk. Two useful measures of stand-alone risk are standard deviation and coefficient of variation. Standard deviation is a statistical measure of the variability of a set of observations as shown below:

If you have a sample of actual historical data, then the standard deviation calculation would be changed as follows:

The coefficient of variation is a better measure of stand-alone risk than standard deviation because it is a standardized measure of risk per unit; it is calculated as the 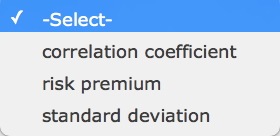 divided by the expected return. The coefficient of variation shows the risk per unit of return, so it provides a more meaningful risk measure when the expected returns on two alternatives are not
  .
.
Quantitative Problem: You are given the following probability distribution for CHC Enterprises:
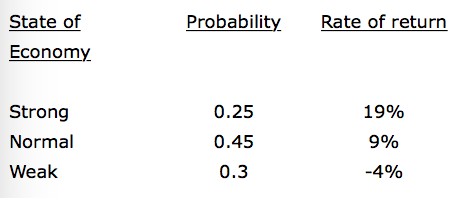
What is the stock's expected return? Round your answer to 2 decimal places. Do not round intermediate calculations. _______%
What is the stock's standard deviation? Round your answer to two decimal places. Do not round intermediate calculations. _______%
What is the stock's coefficient of variation? Round your answer to two decimal places. Do not round intermediate calculations. _______
-Select- one portfolio one asset multiple assets Select risk cost return -Select combined sum standard deviation weighted average of return-f = Pr1 + Pr2 + + P TN = Pri 2T2 + i=1 Select wider tighter broader (n-r)P Standard deviation Estimated - N-1 Select correlation coefficient risk premium standard deviation -Select identical correlated State of Probability Rate of return Economy Strong Normal Weak 0.25 0.45 0.3 19% 9% -4%Step by Step Solution
There are 3 Steps involved in it
Step: 1

Get Instant Access to Expert-Tailored Solutions
See step-by-step solutions with expert insights and AI powered tools for academic success
Step: 2

Step: 3

Ace Your Homework with AI
Get the answers you need in no time with our AI-driven, step-by-step assistance
Get Started


