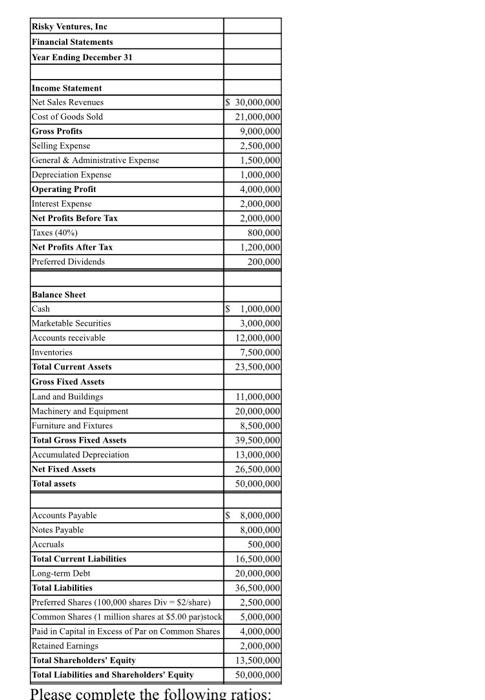
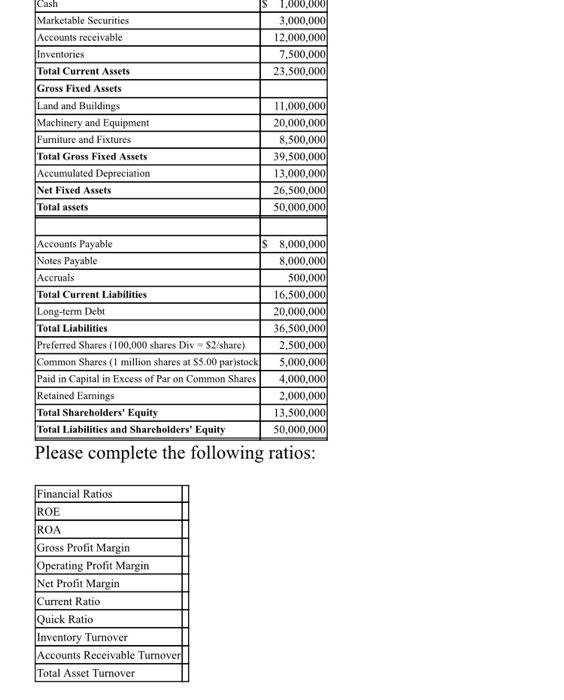
Risky Ventures, Inc Financial Statements Year Ending December 31 Income Statement Net Sales Revenues Cost of Goods Sold Gross Profits Selling Expense General & Administrative Expense Depreciation Expense Operating Profit Interest Expense Net Profits Before Tax Taxes (40%) Net Profits After Tax Preferred Dividends S 30,000,000 21,000,000 9,000,000 2,500,000 1.500.000 1.000.000 4.000.000 2,000,000 2,000,000 800.000 1.200,000 200.000 s 1,000,000 3,000,0001 12,000,000 7,500,0001 23,500,000 Balance Sheet Cash Marketable Securities Accounts receivable Inventories Total Current Assets Gross Fixed Assets Land and Buildings Machinery and Equipment Furniture and Fixtures Total Gross Fixed Assets Accumulated Depreciation Net Fixed Assets Total assets 11.000.000 20,000,000 8,500,000 39,500,000 13,000,000 26,500,000 50,000,000 Accounts Payable S 8,000,000 Notes Payable 8,000,000 Accruals 500,000 Total Current Liabilities 16,500,000 Long-term Debt 20,000,000 Total Liabilities 36,500,000 Preferred Shares (100,000 shares Div - 52/share) 2.500.000 Common Shares (1 million shares at $5.00 parstock 5,000,000 Paid in Capital in Excess of Par on Common Shares 4.000.000 Retained Earnings 2.000.000 Total Shareholders' Equity 13.500.000 Total Liabilities and Shareholders' Equity 50,000,000 Please complete the following ratios: Cash 1.000.0001 3,000,000 12,000,000 7,500,000 23,500,000 Marketable Securities Accounts receivable Inventories Total Current Assets Gross Fixed Assets Land and Buildings Machinery and Equipment Furniture and Fixtures Total Gross Fixed Assets Accumulated Depreciation Net Fixed Assets Total assets 11,000,000 20,000,000 8,500,000 39,500,000 13,000,000 26,500,000 50,000,0001 Accounts Payable IS 8,000,000 Notes Payable 8,000,000 Accruals 500,000 Total Current Liabilities 16,500,000 Long-term Debt 20,000,000 Total Liabilities 36,500,000 Preferred Shares (100,000 shares Div S2/share) 2.500.000 Common Shares (1 million shares at $5.00 parstock 5,000,000 Paid in Capital in Excess of Par on Common Shares 4.000.000 Retained Earnings 2,000,000 Total Shareholders' Equity 13,500,000 Total Liabilities and Shareholders' Equity 50,000,000 Please complete the following ratios: Financial Ratios ROE ROA Gross Profit Margin Operating Profit Margin Net Profit Margin Current Ratio Quick Ratio Inventory Turnover Accounts Receivable Turnover Total Asset Turnover


