Answered step by step
Verified Expert Solution
Link Copied!

Question

1 Approved Answer

Robert has measured the engine speed and horsepower of four different sports cars, listed the data in a table, and graphed the results on a

Robert has measured the engine speed and horsepower of four different sports cars, listed the data in a table, and graphed the results on a scatterplot.He noticed the points fall closely on a line.
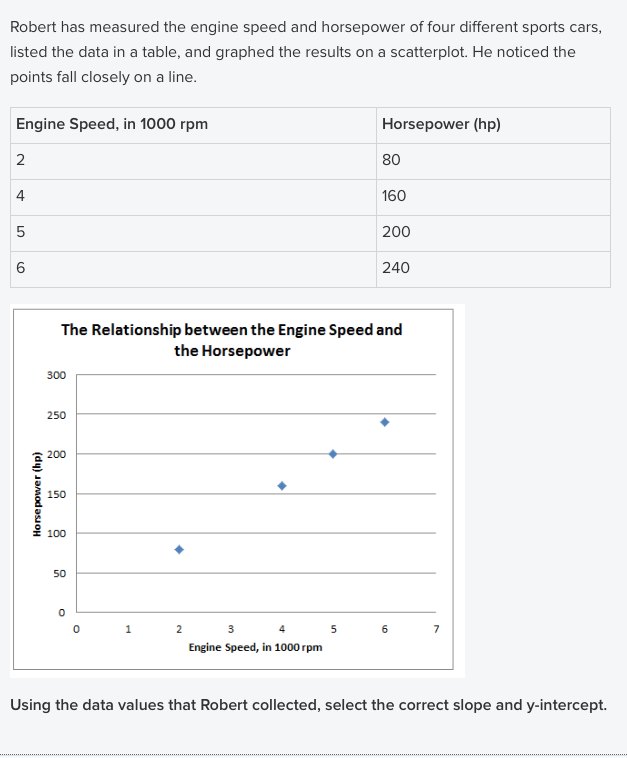
image text in transcribed
Robert has measured the engine speed and horsepower of four different sports cars, listed the data in a table, and graphed the results on a scatterplot. He noticed the points fall closely on a line. Engine Speed, in 1000 rpm Horsepower (hp) 80 4 160 200 6 240 The Relationship between the Engine Speed and the Horsepower 300 250 Horse power (hp) 200 150 100 50 2 3 4 5 6 Engine Speed, in 1000 rpm Using the data values that Robert collected, select the correct slope and y-intercept

Step by Step Solution

There are 3 Steps involved in it

Step: 1

blur-text-image

Get Instant Access to Expert-Tailored Solutions

See step-by-step solutions with expert insights and AI powered tools for academic success

Step: 2

blur-text-image

Step: 3

blur-text-image

Ace Your Homework with AI

Get the answers you need in no time with our AI-driven, step-by-step assistance

Get Started

Recommended Textbook for

Essentials of Business Analytics

Authors: Jeffrey D. Camm, James J. Cochran, Michael J. Fry, Jeffrey W. Ohlmann, David R. Anderson

2nd edition

1305627733, 978-1305861817, 1305861817, 978-0357688960, 978-1305627734

More Books

Students also viewed these Mathematics questions