Answered step by step
Verified Expert Solution
Link Copied!

Question

1 Approved Answer

rocess that Is in control has a mean of # = 12.5 and a standard deviation of a = 0.7. Compute the upper and lower

image text in transcribed
rocess that Is in control has a mean of # = 12.5 and a standard deviation of a = 0.7. Compute the upper and lower control limits If samples of size 4 are to be used. UCL LCL = Construct the x chart for this process. 15.0 15.0 15.0 15.0 14.51 14.5- 14.5 14.5- 14.0 14.0 UCL UCL 13.5 + 14.0 14.0 UCL 135 13.0 1 1 13.0 13.0 13.0 UCL 1 12.5 125 12.5- B. 12.0 2. 120 A. 120 A. 12.0 11.5 LCL 11.5 11.0- 11.5 LCL 11.0 LCL. E 11.5 in 11.0 LCL 11.0 10.5 105 10.5 105 10 10 2 6 8 10 2 4 6 8 10 Sample Number Sample Number Sample Number Sample Number (b) Compute the upper and lower control limits if samples of size 8 are to be used. (Round your answers to three decimal places.) UCL - LCL - Construct the x chart for this process. 14.5 14.5 14.5 14.5 14.0 14.0 13.3 14.0 UCL 14.0 UCL 13.5 UCL 13.5 13.5 UCL 13.0 13.0 13.0 @ 12.5 1 13.0 612.5 12.0 6 12.5 2 12.0 12.5 11.5 12.0 LCL 11.5 12.0 11.0 1 LCL 1 11.0 110 LCL 11.0 LCL 10 8 10 2 6 8 10 6 8 10 Sample Number Sample Number Sample Number Sample Number Compute the upper and lower control limits If samples of size 16 are to be used. UCL - LCL Construct the x chart for this process. 14.5 14.5- 14.0 14.5 14.0 14.5 13.5 14.0 13.5 14.0 13.0 UCL 13.0 UCL 13.5 UCL 13.0 13.5 UCL 12.5 12.5 8 1 12.0 125 LCL 12.0 115 2 12.0 12.5 11.5 LCL. 2 12.0 11.0 115 110 LCL. 11.0 1 LCL 11.0- 4 6 10 2 6 10 8 Sample Number 10 6 8 10 Sample Number Sample Number Sample Number (c) What happens to the limits of the control chart as the sample size is increased? Discuss why this is reasonable. The limits become -Select as n increases. If the process is In control, the larger samples should have -Select- V variance and should fall -Select- V ) , = 12.5

Step by Step Solution

There are 3 Steps involved in it

Step: 1

blur-text-image

Get Instant Access with AI-Powered Solutions

See step-by-step solutions with expert insights and AI powered tools for academic success

Step: 2

blur-text-image

Step: 3

blur-text-image

Ace Your Homework with AI

Get the answers you need in no time with our AI-driven, step-by-step assistance

Get Started

Recommended Textbook for

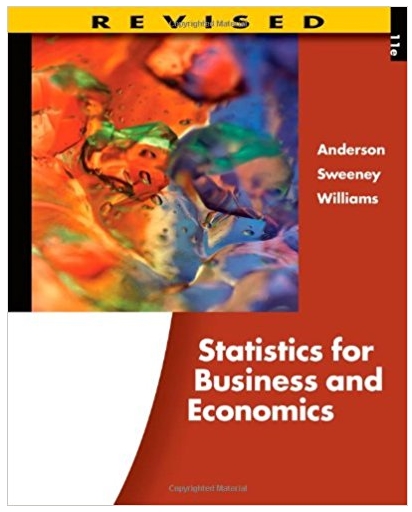
Statistics For Business And Economics

Authors: David R. Anderson, Dennis J. Sweeney, Thomas A. Williams

11th Edition

9780538481649

More Books

Students also viewed these Mathematics questions