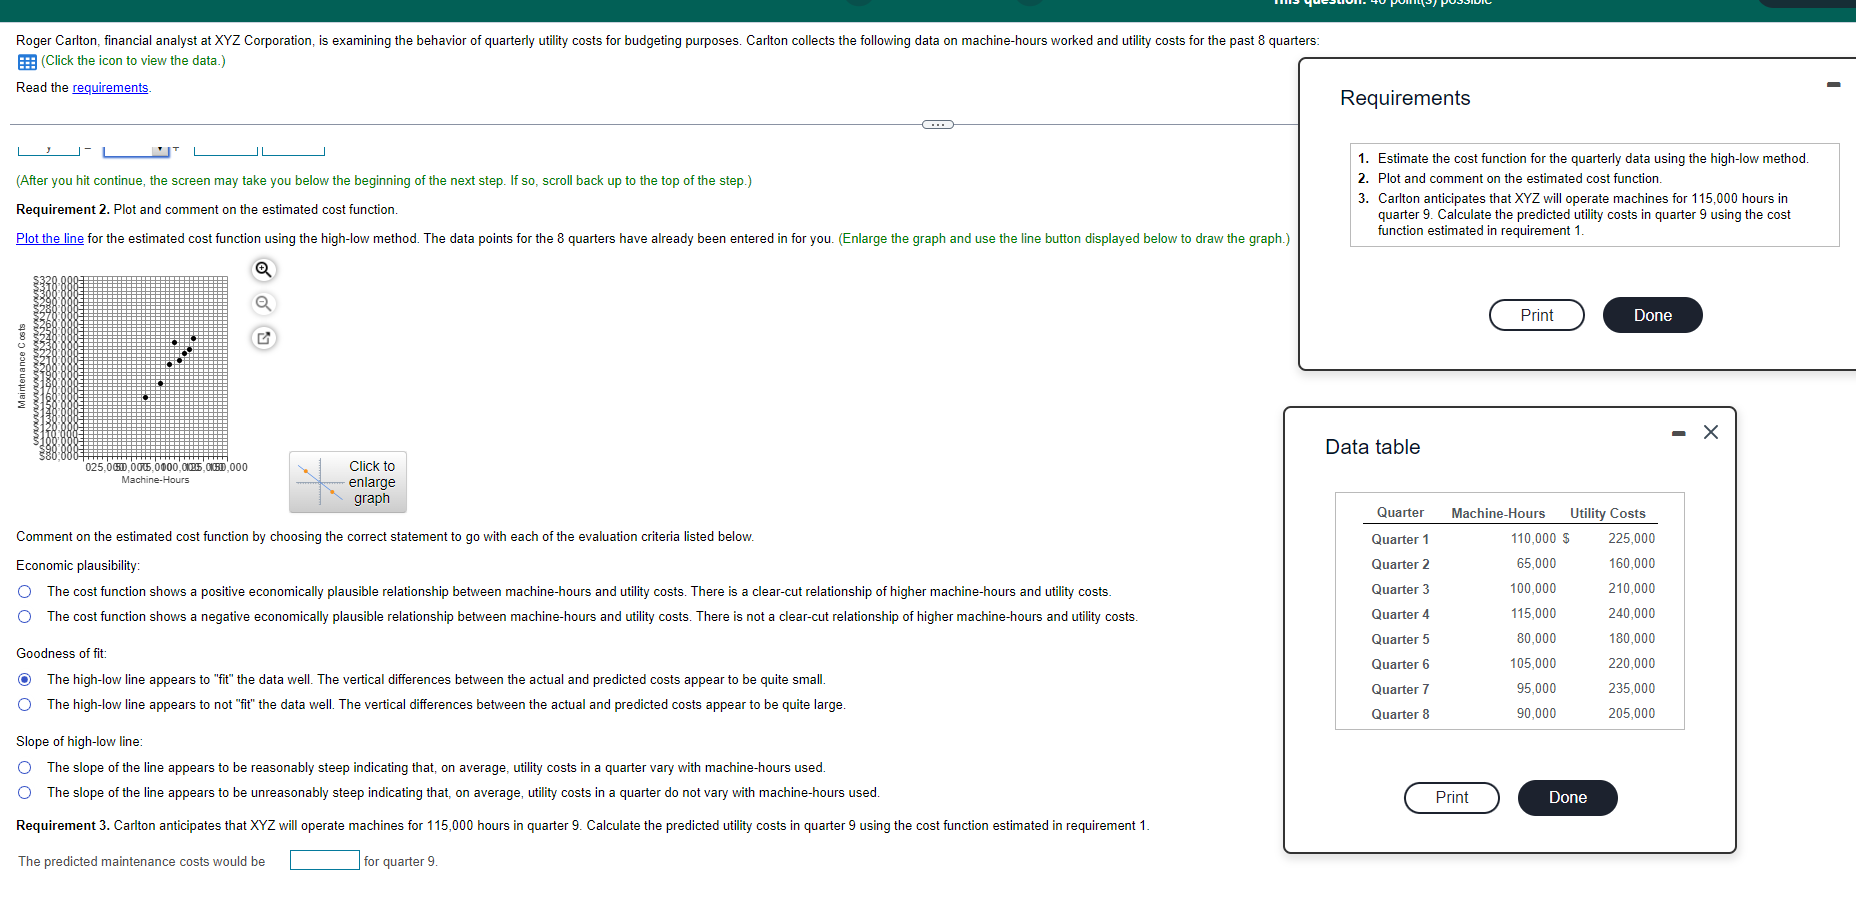
Roger Carlton, financial analyst at XYZ Corporation, is examining the behavior of quarterly utility costs for budgeting purposes. Carlton collects the following data on machine-hours worked and utility costs for the past 8 quarters: E(Click the icon to view the data.) Read the requirements Requirements .. (After you hit continue, the screen may take you below the beginning of the next step. If so, scroll back up to the top of the step.) 1. Estimate the cost function for the quarterly data using the high-low method. 2. Plot and comment on the estimated cost function. 3. Carlton anticipates that XYZ will operate machines for 115,000 hours in quarter 9. Calculate the predicted utility costs in quarter 9 using the cost function estimated in requirement 1. Requirement 2. Plot and comment on the estimated cost function Plot the line for the estimated cost function using the high-low method. The data points for the 8 quarters have already been entered in for you. (Enlarge the graph and use the line button displayed below to draw the graph.) Print Done Maintenance Costs Data table 025.000.000.00000025 OD000 Machine-Hours Click to enlarge graph Quarter Comment on the estimated cost function by choosing the correct statement to go with each of the evaluation criteria listed below. Quarter 1 Quarter 2 Economic plausibility: The cost function shows a positive economically plausible relationship between machine-hours and utility costs. There is a clear-cut relationship of higher machine-hours and utility costs. The cost function shows a negative economically plausible relationship between machine-hours and utility costs. There is not a clear-cut relationship of higher machine-hours and utility costs Machine-Hours Utility Costs 110,000 $ 225,000 65,000 160,000 100,000 210,000 115,000 240,000 Quarter 3 Quarter 4 Quarter 5 80,000 180,000 Goodness of fit: Quarter 6 220,000 O The high-low line appears to "fit" the data well. The vertical differences between the actual and predicted costs appear to be quite small The high-low line appears to not "fit" the data well. The vertical differences between the actual and predicted costs appear to be quite large. 105,000 95,000 Quarter 7 235,000 Quarter 8 90,000 205,000 Slope of high-low line: The slope of the line appears to be reasonably steep indicating that, on average, utility costs in a quarter vary with machine-hours used. O The slope of the line appears to be unreasonably steep indicating that, average, utility costs in a quarter do not vary with machine-hours used. Print Done Requirement 3. Carlton anticipates that XYZ will operate machines for 115,000 hours in quarter 9. Calculate the predicted utility costs in quarter 9 using the cost function estimated in requirement 1. The predicted maintenance costs would be for quarter 9. Roger Carlton, financial analyst at XYZ Corporation, is examining the behavior of quarterly utility costs for budgeting purposes. Carlton collects the following data on machine-hours worked and utility costs for the past 8 quarters: E(Click the icon to view the data.) Read the requirements Requirements .. (After you hit continue, the screen may take you below the beginning of the next step. If so, scroll back up to the top of the step.) 1. Estimate the cost function for the quarterly data using the high-low method. 2. Plot and comment on the estimated cost function. 3. Carlton anticipates that XYZ will operate machines for 115,000 hours in quarter 9. Calculate the predicted utility costs in quarter 9 using the cost function estimated in requirement 1. Requirement 2. Plot and comment on the estimated cost function Plot the line for the estimated cost function using the high-low method. The data points for the 8 quarters have already been entered in for you. (Enlarge the graph and use the line button displayed below to draw the graph.) Print Done Maintenance Costs Data table 025.000.000.00000025 OD000 Machine-Hours Click to enlarge graph Quarter Comment on the estimated cost function by choosing the correct statement to go with each of the evaluation criteria listed below. Quarter 1 Quarter 2 Economic plausibility: The cost function shows a positive economically plausible relationship between machine-hours and utility costs. There is a clear-cut relationship of higher machine-hours and utility costs. The cost function shows a negative economically plausible relationship between machine-hours and utility costs. There is not a clear-cut relationship of higher machine-hours and utility costs Machine-Hours Utility Costs 110,000 $ 225,000 65,000 160,000 100,000 210,000 115,000 240,000 Quarter 3 Quarter 4 Quarter 5 80,000 180,000 Goodness of fit: Quarter 6 220,000 O The high-low line appears to "fit" the data well. The vertical differences between the actual and predicted costs appear to be quite small The high-low line appears to not "fit" the data well. The vertical differences between the actual and predicted costs appear to be quite large. 105,000 95,000 Quarter 7 235,000 Quarter 8 90,000 205,000 Slope of high-low line: The slope of the line appears to be reasonably steep indicating that, on average, utility costs in a quarter vary with machine-hours used. O The slope of the line appears to be unreasonably steep indicating that, average, utility costs in a quarter do not vary with machine-hours used. Print Done Requirement 3. Carlton anticipates that XYZ will operate machines for 115,000 hours in quarter 9. Calculate the predicted utility costs in quarter 9 using the cost function estimated in requirement 1. The predicted maintenance costs would be for quarter 9