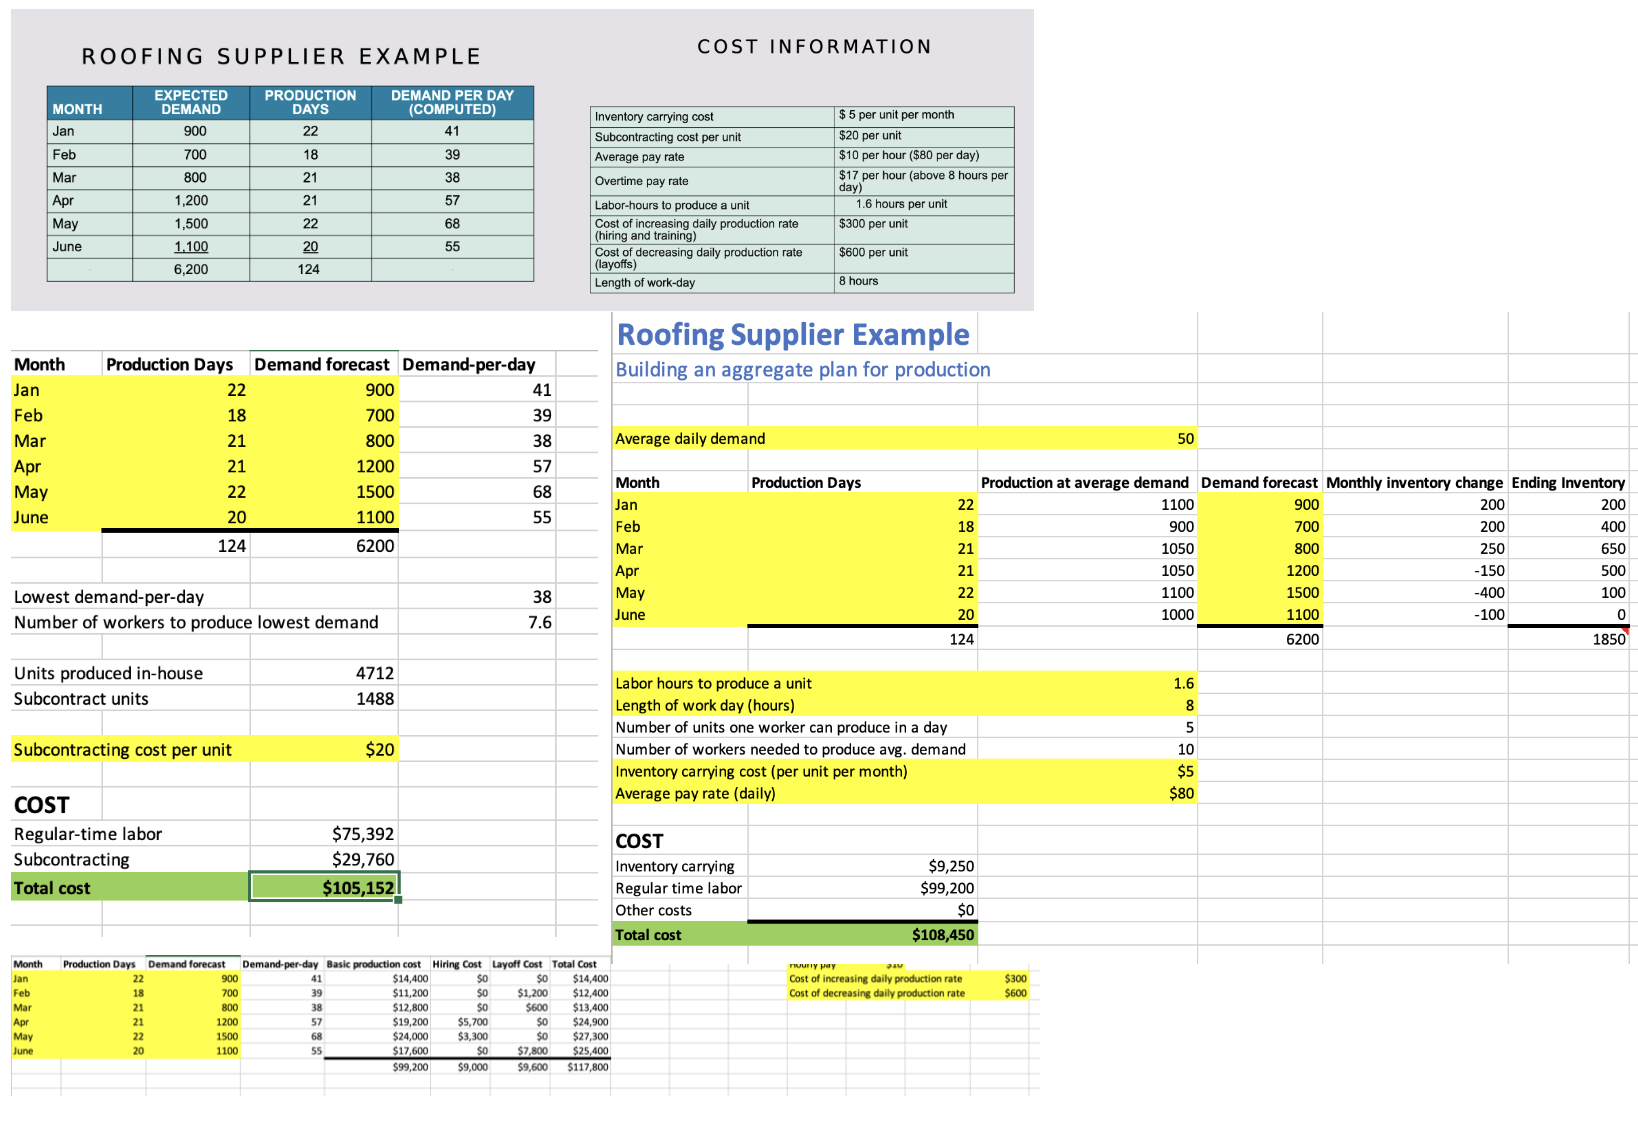
ROOFING SUPPLIER EXAMPLE COST INFORMATION MONTH EXPECTED DEMAND PRODUCTION DAYS DEMAND PER DAY (COMPUTED) Inventory carrying cost Jan 900 22 41 Feb 700 39

ROOFING SUPPLIER EXAMPLE COST INFORMATION MONTH EXPECTED DEMAND PRODUCTION DAYS DEMAND PER DAY (COMPUTED) Inventory carrying cost Jan 900 22 41 Feb 700 39 Average pay rate Mar 800 Apr 1,200 May 1,500 June 1,100 6,200 124 22222 38 Overtime pay rate Subcontracting cost per unit $5 per unit per month $20 per unit $10 per hour ($80 per day) $17 per hour (above 8 hours per day) 57 Labor-hours to produce a unit 1.6 hours per unit 68 Cost of increasing daily production rate (hiring and training) $300 per unit 55 Cost of decreasing daily production rate (layoffs) $600 per unit Length of work-day 8 hours Roofing Supplier Example 50 Production at average demand Demand forecast Monthly inventory change Ending Inventory Month Production Days Demand forecast Demand-per-day Building an aggregate plan for production Jan 22 900 41 Feb 18 700 39 Mar 21 800 38 Average daily demand Apr 21 1200 57 Month Production Days May 22 1500 68 Jan June 20 1100 55 Feb 124 6200 Mar Apr Lowest demand-per-day Number of workers to produce lowest demand 38 May June 7.6 2222222 18 21 21 1100 900 200 200 900 700 200 400 1050 800 250 650 1050 1200 -150 500 1100 1500 -400 100 20 1000 1100 -100 0 124 6200 1850 Units produced in-house Subcontract units 4712 1488 Subcontracting cost per unit $20 COST Regular-time labor Subcontracting Total cost $75,392 $29,760 $105,152 Month Production Days Demand forecast Demand-per-day Basic production cost Hiring Cost Layoff Cost Total Cost Labor hours to produce a unit Length of work day (hours) Number of units one worker can produce in a day Number of workers needed to produce avg. demand Inventory carrying cost (per unit per month) Average pay rate (daily) COST Inventory carrying Regular time labor Other costs Total cost $9,250 $99,200 $0 $108,450 Jan 22 900 41 $14,400 $0 $0 $14,400 Feb 18 700 39 $11,200 $0 $1,200 $12,400 Mar 21 800 38 $12,800 $0 $600 $13,400 Apr 21 1200 57 $19,200 $5,700 $0 $24,900 May 22 1500 68 $24,000 $3,300 $0 $27,300 June 20 1100 55 $17,600 $99,200 $0 $9,000 $7,800 $9,600 $25,400 $117,800 Hourly pay 320 Cost of increasing daily production rate Cost of decreasing daily production rate $300 $600 1.6 8 5 10 $5 $80
Step by Step Solution
There are 3 Steps involved in it
Step: 1

See step-by-step solutions with expert insights and AI powered tools for academic success
Step: 2

Step: 3

Ace Your Homework with AI
Get the answers you need in no time with our AI-driven, step-by-step assistance
Get Started


