

Answered step by step
Verified Expert Solution
Question
1 Approved Answer
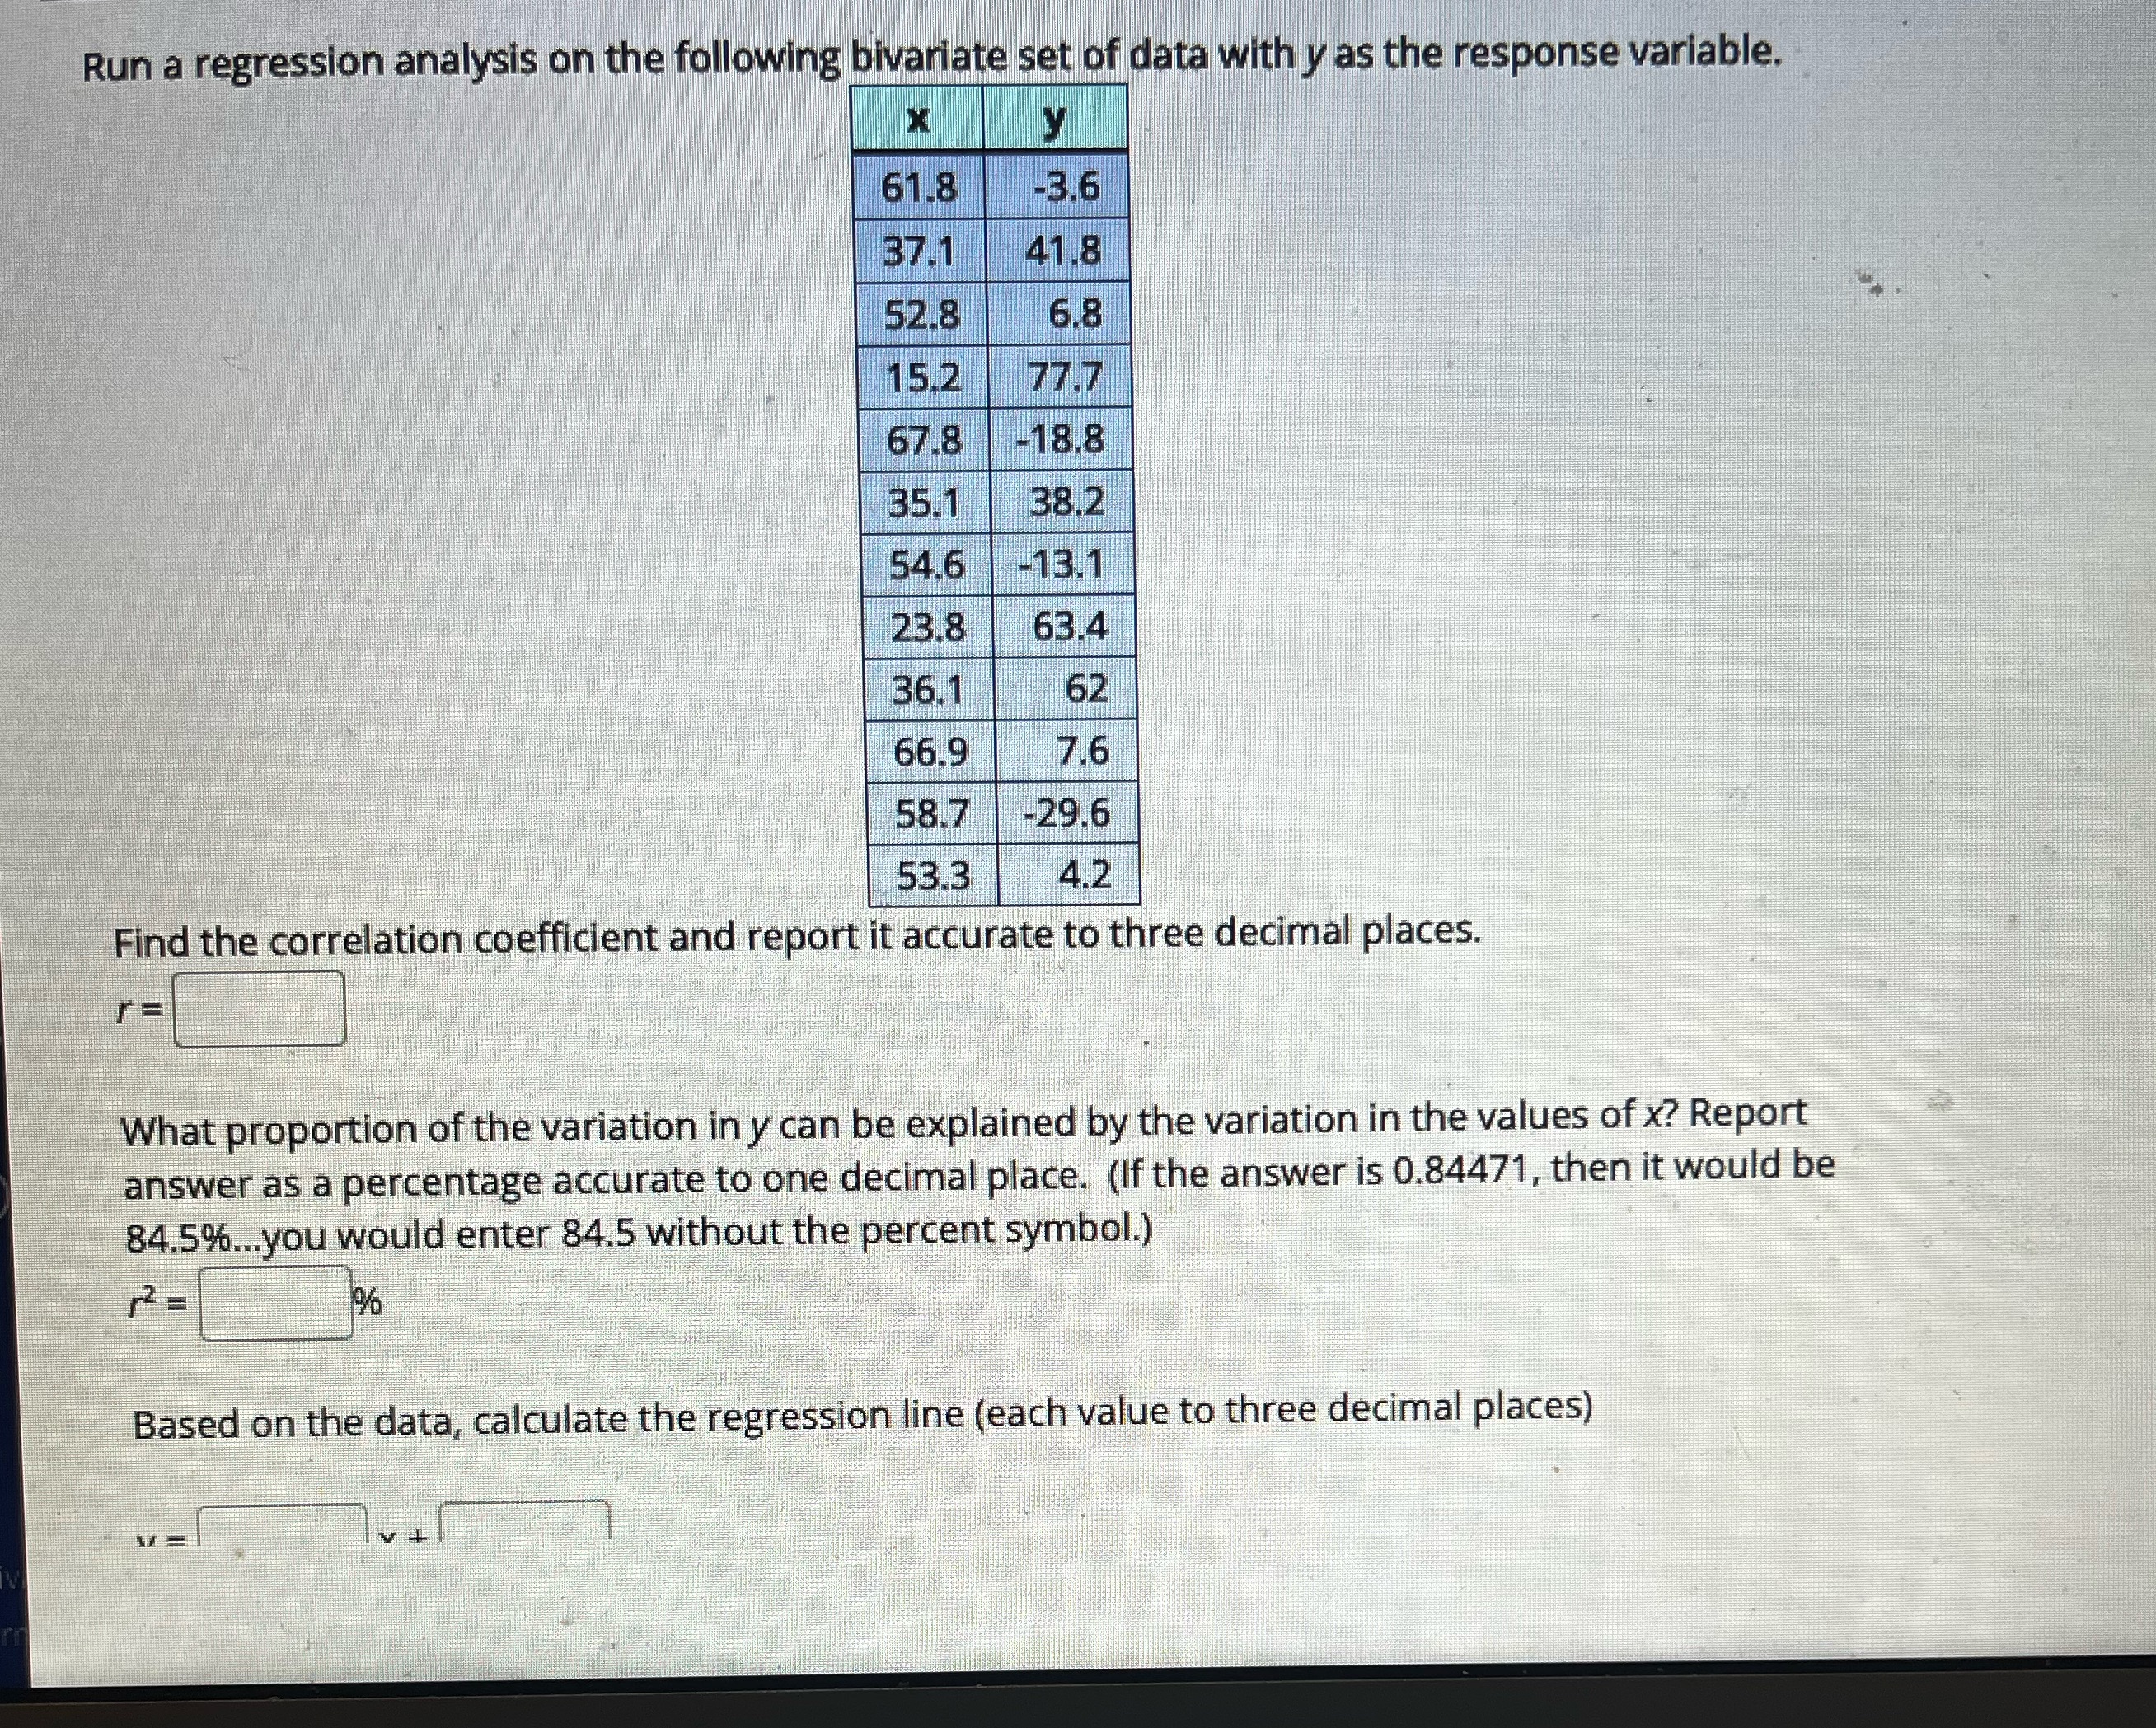
Run a regression analysis on the following bivariate set of data with y as the response variable. X 61.8 -3.6 37.1 41.8 52.8 6.8 15.2
Step by Step Solution
There are 3 Steps involved in it
Step: 1

Get Instant Access to Expert-Tailored Solutions
See step-by-step solutions with expert insights and AI powered tools for academic success
Step: 2

Step: 3
Ace Your Homework with AI
Get the answers you need in no time with our AI-driven, step-by-step assistance
Get Started
Discrete and Combinatorial Mathematics An Applied Introduction
Authors: Ralph P. Grimaldi
5th edition
201726343, 978-0201726343