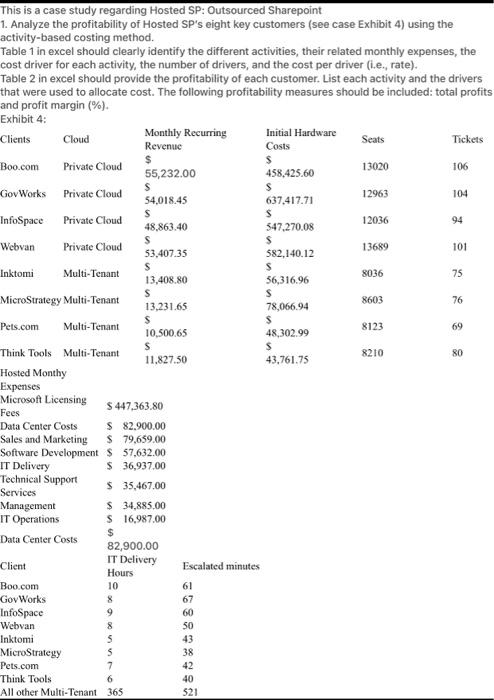
s 13689 $ This is a case study regarding Hosted SP: Outsourced Sharepoint 1. Analyze the profitability of Hosted SP's eight key customers (see case Exhibit 4) using the activity-based costing method. Table 1 in excel should clearly identify the different activities, their related monthly expenses, the cost driver for each activity, the number of drivers, and the cost per driver (i.e. rate). Table 2 in excel should provide the profitability of each customer. List each activity and the drivers that were used to allocate cost. The following profitability measures should be included: total profits and profit margin (%) Exhibit 4: Clients Cloud Monthly Recurring Initial Hardware Revenue Seats Costs Tickets $ $ Boo.com Private Cloud 55,232.00 106 13020 458,425.60 S S Gov Works Private Cloud 54,018.45 637.417.71 12963 104 $ InfoSpace Private Cloud 12036 94 48.863.40 547,270.08 S Webvan Private Cloud 53.407.35 582,140.12 101 s s Inktomi Multi-Tenant 8036 75 13,408.80 56,316.96 s s MicroStrategy Multi-Tenant 8603 13,231.65 78,066.94 76 $ Pets.com Multi-Tenant 10,500,65 48,302.99 8123 69 S $ Think Tools Multi-Tenant RO 11,827.50 8210 43,761.75 Hosted Monthy Expenses Microsoft Licensing S 447,363.80 Fees Data Center Costs $ 82.900.00 Sales and Marketing $ 79,659.00 Software Development $ 57.632.00 IT Delivery $36,937.00 Technical Support $ 35,467.00 Services Management $ 34,885,00 IT Operations S 16,987.00 $ Data Center Costs 82,900.00 Client IT Delivery Escalated minutes Hours Boo.com 10 61 Gov Works 8 67 InfoSpace 9 60 Webvan SO Inktomi 5 43 MicroStrategy Pets.com 42 Think Tools 40 All other Multi-Tenant 365 521 8 38 6 s 13689 $ This is a case study regarding Hosted SP: Outsourced Sharepoint 1. Analyze the profitability of Hosted SP's eight key customers (see case Exhibit 4) using the activity-based costing method. Table 1 in excel should clearly identify the different activities, their related monthly expenses, the cost driver for each activity, the number of drivers, and the cost per driver (i.e. rate). Table 2 in excel should provide the profitability of each customer. List each activity and the drivers that were used to allocate cost. The following profitability measures should be included: total profits and profit margin (%) Exhibit 4: Clients Cloud Monthly Recurring Initial Hardware Revenue Seats Costs Tickets $ $ Boo.com Private Cloud 55,232.00 106 13020 458,425.60 S S Gov Works Private Cloud 54,018.45 637.417.71 12963 104 $ InfoSpace Private Cloud 12036 94 48.863.40 547,270.08 S Webvan Private Cloud 53.407.35 582,140.12 101 s s Inktomi Multi-Tenant 8036 75 13,408.80 56,316.96 s s MicroStrategy Multi-Tenant 8603 13,231.65 78,066.94 76 $ Pets.com Multi-Tenant 10,500,65 48,302.99 8123 69 S $ Think Tools Multi-Tenant RO 11,827.50 8210 43,761.75 Hosted Monthy Expenses Microsoft Licensing S 447,363.80 Fees Data Center Costs $ 82.900.00 Sales and Marketing $ 79,659.00 Software Development $ 57.632.00 IT Delivery $36,937.00 Technical Support $ 35,467.00 Services Management $ 34,885,00 IT Operations S 16,987.00 $ Data Center Costs 82,900.00 Client IT Delivery Escalated minutes Hours Boo.com 10 61 Gov Works 8 67 InfoSpace 9 60 Webvan SO Inktomi 5 43 MicroStrategy Pets.com 42 Think Tools 40 All other Multi-Tenant 365 521 8 38 6


