

Answered step by step
Verified Expert Solution
Question
1 Approved Answer
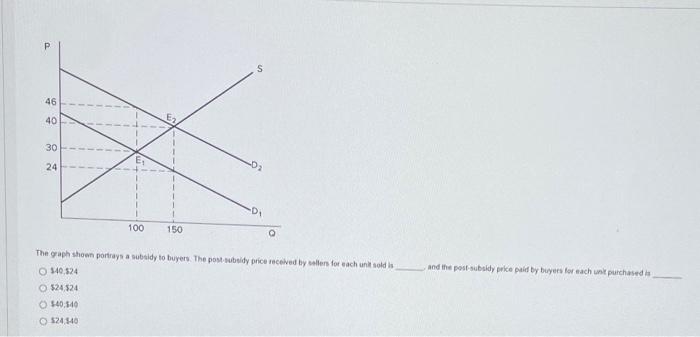
S 46 40 30 24 100 150 The graph shown portrays a subsidy to buyers. The post subsidy price received by sellers for each unk

Step by Step Solution
There are 3 Steps involved in it
Step: 1

Get Instant Access to Expert-Tailored Solutions
See step-by-step solutions with expert insights and AI powered tools for academic success
Step: 2

Step: 3
Ace Your Homework with AI
Get the answers you need in no time with our AI-driven, step-by-step assistance
Get Started
The Economics of Public Issues
Authors: Roger LeRoy Miller, Daniel K. Benjamin, Douglass C. North
19th edition
134018974, 134018973, 9780134020532 , 978-0134018973