

Answered step by step
Verified Expert Solution
Question
1 Approved Answer
s la la O e EX ec ec sta da da Data table (Click on the icon here in order to copy the contents
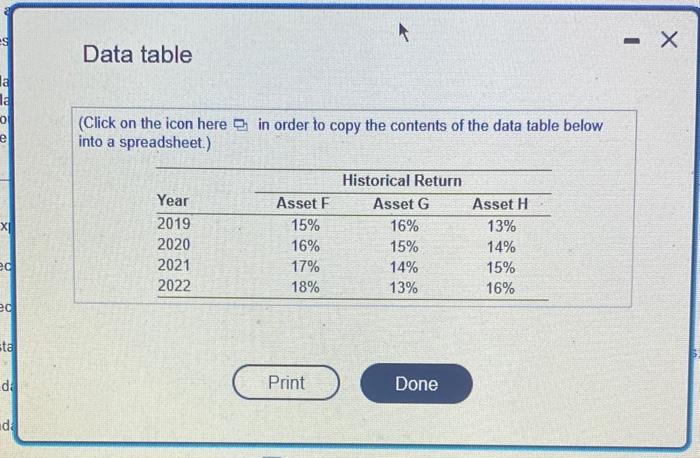
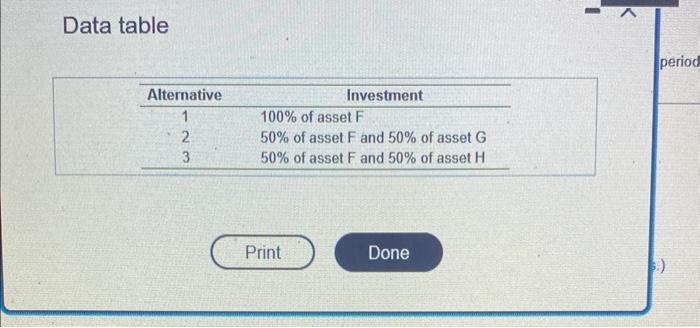
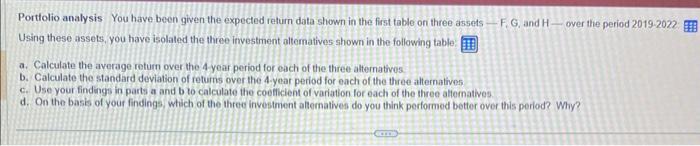
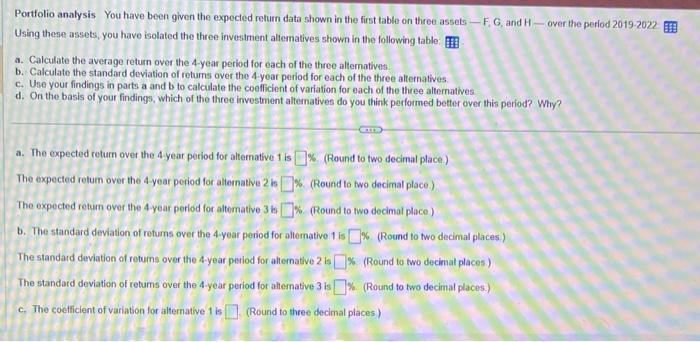
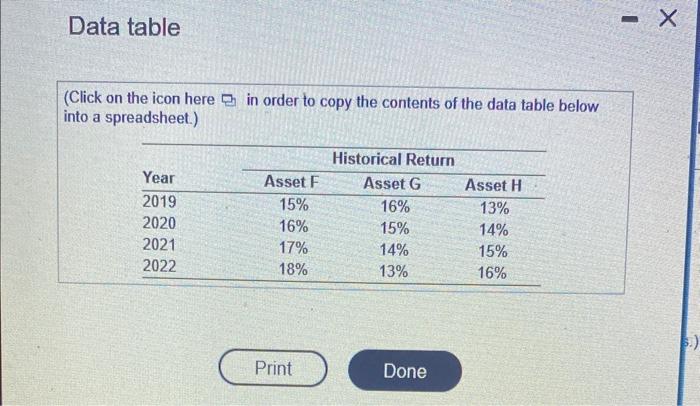
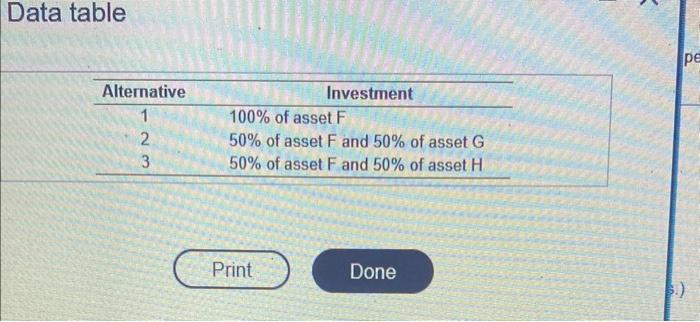
s la la O e EX ec ec sta da da Data table (Click on the icon here in order to copy the contents of the data table below into a spreadsheet.) Year 2019 2020 2021 2022 Asset F 15% 16% 17% 18% Print Historical Return Asset G 16% 15% 14% 13% Done Asset H 13% 14% 15% 16% - X - Data table Alternative 1 2 3 Investment 100% of asset F 50% of asset F and 50% of asset G 50% of asset F and 50% of asset Hi Print Done period Portfolio analysis You have been given the expected return data shown in the first table on three assets-F. G, and H- Using these assets, you have isolated the three investment alternatives shown in the following table over the period 2019-2022 a. Calculate the average return over the 4-year period for each of the three alternatives. b. Calculate the standard deviation of returns over the 4-year period for each of the three alternatives c. Use your findings in parts a and b to calculate the coefficient of variation for each of the three alternatives. d. On the basis of your findings, which of the three investment alternatives do you think performed better over this period? Why? Comm Portfolio analysis You have been given the expected return data shown in the first table on three assets-F, G, and H-over the period 2019-2022 Using these assets, you have isolated the three investment alternatives shown in the following table a. Calculate the average return over the 4-year period for each of the three alternatives b. Calculate the standard deviation of returns over the 4-year period for each of the three alternatives. c. Use your findings in parts a and b to calculate the coefficient of variation for each of the three alternatives d. On the basis of your findings, which of the three investment alternatives do you think performed better over this period? Why? a. The expected return over the 4-year period for alternative 1 is% (Round to two decimal place.) The expected return over the 4-year period for alternative 2 is% (Round to two decimal place.) The expected return over the 4-year period for alternative 3 is% (Round to two decimal place.) b. The standard deviation of returns over the 4-year period for alternative 1 is % (Round to two decimal places) The standard deviation of returns over the 4-year period for alternative 2 is % (Round to two decimal places) The standard deviation of retums over the 4-year period for alternative 3 is% (Round to two decimal places.) c. The coefficient of variation for alternative 1 is (Round to three decimal places) Data table (Click on the icon here in order to copy the contents of the data table below into a spreadsheet.) Year 2019 2020 2021 2022 Asset F 15% 16% 17% 18% Print Historical Return Asset G 16% 15% 14% 13% Done Asset H 13% 14% 15% 16% I X Data table Alternative 1 2 23 Investment 100% of asset F 50% of asset F and 50% of asset G 50% of asset F and 50% of asset H Print Done pe
Step by Step Solution
★★★★★
3.42 Rating (149 Votes )
There are 3 Steps involved in it
Step: 1
Portfolio Analysis a Average Return Alternative 1 100 of Asset F Average Return 015 016 017 015 4 01...
Get Instant Access to Expert-Tailored Solutions
See step-by-step solutions with expert insights and AI powered tools for academic success
Step: 2

Step: 3
Ace Your Homework with AI
Get the answers you need in no time with our AI-driven, step-by-step assistance
Get Started
Statistics
Authors: Robert S. Witte, John S. Witte
11th Edition
1119254515, 978-1119254515