

Question
S olve for 2 from each category: Profitability gross profit margin, operating profit margin, net return on total assets, ROE; Liquidity current ratio, working capital;
S
olve for 2 from each category:
Profitability gross profit margin, operating profit margin, net return on total assets, ROE;
Liquidity current ratio, working capital; leverage total debt to assets, debt to equity, times interest earned;
Activity (if appropriate) days of inventory, inventory turnover)
Describe/calculate/discuss last three years. Show all of your work. What is the takeaway for each plus the company as a whole?
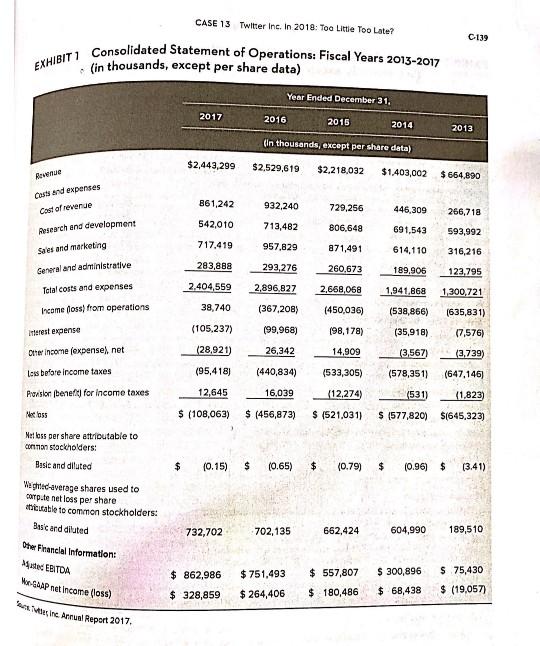
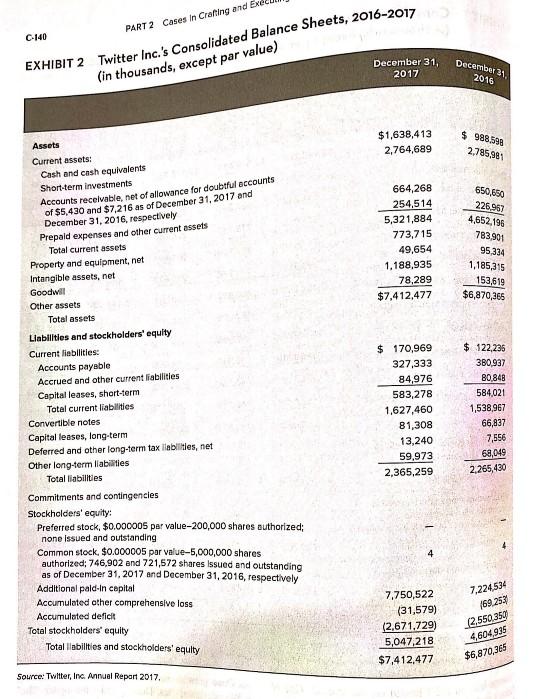
EXHIBIT 1 Consolidated Statement of Operations: Fiscal Years 2013-2017 Mesin Arnual Report 2017. CASE 13 Twitter Inc. In 2018: Too Little Too Late? C-139 thousands, except per share data Year Ended December 31. 2017 2016 2016 2014 2013 (In thousands, except per share data) $2,443,299 $2,529,619 $2,218,032 Revere $1,403,002 $ 664.890 Cod and expenses Cost of revenue 861,242 932.240 729,256 446,309 266,718 542,010 713,482 806,648 691,543 593,992 717.419 Research and development Sales and marketing General and administrative 957.829 a71,491 614.110 316,216 283,888 293, 276 260,673 189,906 123,795 Total costs and expenses 2.404,559 2.896,827 2,668,068 1,941,868 1,300,721 Income foss) from operations 38,740 (450,036) (538,866) (635,831) (367,208) (99,968) (98,178) (35,918) (7,576) Interest expense Other income (expensel.net (105,237) (28,921) 26,342 14,909 (3,567) (3,739) less before income taxes (95,418) (440,834) (533,305) (578,351) (647,146) Pression benefit for income taxes 12,645 16,039 (531) (1,823) (12,274 $ (521,031) $ (108,063) $ (456,873) $ (577,820) $(645,323) Nel loss per share attributable to common stockholders: Basle and diluted $ (0.15) $ (0.65) $ (0.79) $ (0.96) $ (3.41) Waghted average shares used to carp.tenet loss per share sicutable to common stockholders: Basic and dilated 732,702 702,135 662,424 604,990 189,510 the Financial Information: Med EBITDA WO-GAAP Net Income (loss) $ 862,986 $ 751,493 $ 300,896 $ 75,430 $ 557,807 $ 180,486 $ 328,859 $ 264,406 $ 68,438 $ (19.057) PART 2 Cases in Crafting and C-140 (in thousands, except par value) December 21 2016 $ 988.590 2,785,981 650,650 226,967 4,652.196 783,901 95,334 1,185,315 153,619 $6,870,366 Twitter Inc.'s Consolidated Balance Sheets, 2016-2017 $7,412,477$6,870,365 EXHIBIT 2 December 31, 2017 Assets $1,638,413 Current assets: 2,764,689 Cash and cash equivalents Short-term investments Accounts receivable, net of allowance for doubtful accounts 664,268 of $5,430 and $7,216 as of December 31, 2017 and 254,514 December 31, 2016, respectively 5,321,884 Prepaid expenses and other current assets 773,715 Total current assets Property and equipment, net 49,654 Intangible assets, net 1,188,935 Goodwill 78,289 Other assets $7,412,477 Total assets Llabilities and stockholders' equity Current liabilities: $ 170,969 Accounts payable 327,333 Accrued and other current liabilities Capital leases, short-term 84,976 Total current liabilities 583,278 Convertible notes 1,627,460 Capital leases, long-term 81,308 Deferred and other long-term tax liabilitles, net 13,240 Other long-term liabilities 59,973 Total liabilities 2,365,259 Commitments and contingencies Stockholders' equity: Preferred stock. $0.000005 par value-200,000 shares authorized: none Issued and outstanding Common stock. $0.000005 por value-5,000,000 shares authorized: 746,902 and 721,572 shares Issued and outstanding 4 as of December 31, 2017 and December 31, 2016, respectively Additional pald-in capital Accumulated other comprehensive loss 7,750,522 Accumulated deficit (31,579) Total stockholders' equity (2,671,729) Total abilities and stockholders' equity 5,047,218 $ 122,235 380.937 80,848 584,021 1,538,967 66,837 7,556 68,049 2,265,430 7,224,534 169.253 2.550.359 4,604,935 Source: Twitter, Inc. Annual Report 2017 EXHIBIT 1 Consolidated Statement of Operations: Fiscal Years 2013-2017 Mesin Arnual Report 2017. CASE 13 Twitter Inc. In 2018: Too Little Too Late? C-139 thousands, except per share data Year Ended December 31. 2017 2016 2016 2014 2013 (In thousands, except per share data) $2,443,299 $2,529,619 $2,218,032 Revere $1,403,002 $ 664.890 Cod and expenses Cost of revenue 861,242 932.240 729,256 446,309 266,718 542,010 713,482 806,648 691,543 593,992 717.419 Research and development Sales and marketing General and administrative 957.829 a71,491 614.110 316,216 283,888 293, 276 260,673 189,906 123,795 Total costs and expenses 2.404,559 2.896,827 2,668,068 1,941,868 1,300,721 Income foss) from operations 38,740 (450,036) (538,866) (635,831) (367,208) (99,968) (98,178) (35,918) (7,576) Interest expense Other income (expensel.net (105,237) (28,921) 26,342 14,909 (3,567) (3,739) less before income taxes (95,418) (440,834) (533,305) (578,351) (647,146) Pression benefit for income taxes 12,645 16,039 (531) (1,823) (12,274 $ (521,031) $ (108,063) $ (456,873) $ (577,820) $(645,323) Nel loss per share attributable to common stockholders: Basle and diluted $ (0.15) $ (0.65) $ (0.79) $ (0.96) $ (3.41) Waghted average shares used to carp.tenet loss per share sicutable to common stockholders: Basic and dilated 732,702 702,135 662,424 604,990 189,510 the Financial Information: Med EBITDA WO-GAAP Net Income (loss) $ 862,986 $ 751,493 $ 300,896 $ 75,430 $ 557,807 $ 180,486 $ 328,859 $ 264,406 $ 68,438 $ (19.057) PART 2 Cases in Crafting and C-140 (in thousands, except par value) December 21 2016 $ 988.590 2,785,981 650,650 226,967 4,652.196 783,901 95,334 1,185,315 153,619 $6,870,366 Twitter Inc.'s Consolidated Balance Sheets, 2016-2017 $7,412,477$6,870,365 EXHIBIT 2 December 31, 2017 Assets $1,638,413 Current assets: 2,764,689 Cash and cash equivalents Short-term investments Accounts receivable, net of allowance for doubtful accounts 664,268 of $5,430 and $7,216 as of December 31, 2017 and 254,514 December 31, 2016, respectively 5,321,884 Prepaid expenses and other current assets 773,715 Total current assets Property and equipment, net 49,654 Intangible assets, net 1,188,935 Goodwill 78,289 Other assets $7,412,477 Total assets Llabilities and stockholders' equity Current liabilities: $ 170,969 Accounts payable 327,333 Accrued and other current liabilities Capital leases, short-term 84,976 Total current liabilities 583,278 Convertible notes 1,627,460 Capital leases, long-term 81,308 Deferred and other long-term tax liabilitles, net 13,240 Other long-term liabilities 59,973 Total liabilities 2,365,259 Commitments and contingencies Stockholders' equity: Preferred stock. $0.000005 par value-200,000 shares authorized: none Issued and outstanding Common stock. $0.000005 por value-5,000,000 shares authorized: 746,902 and 721,572 shares Issued and outstanding 4 as of December 31, 2017 and December 31, 2016, respectively Additional pald-in capital Accumulated other comprehensive loss 7,750,522 Accumulated deficit (31,579) Total stockholders' equity (2,671,729) Total abilities and stockholders' equity 5,047,218 $ 122,235 380.937 80,848 584,021 1,538,967 66,837 7,556 68,049 2,265,430 7,224,534 169.253 2.550.359 4,604,935 Source: Twitter, Inc. Annual Report 2017
Step by Step Solution
There are 3 Steps involved in it
Step: 1

Get Instant Access to Expert-Tailored Solutions
See step-by-step solutions with expert insights and AI powered tools for academic success
Step: 2

Step: 3
Ace Your Homework with AI
Get the answers you need in no time with our AI-driven, step-by-step assistance
Get Started
Fundamentals Of Financial Management Concise
Authors: Eugene F. Brigham, Joel F. Houston
11th Edition
0357517717, 9780357517710