Question
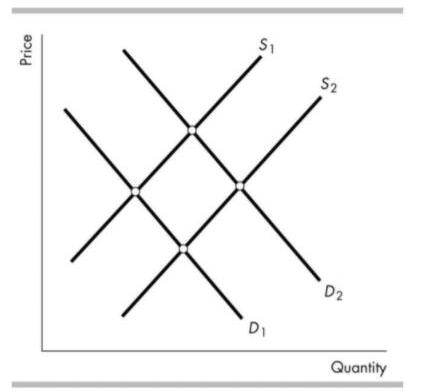
2. The figure above shows the market for candy. People become more concerned that eating candy causes them to gain weight, which they do


2. The figure above shows the market for candy. People become more concerned that eating candy causes them to gain weight, which they do not like. As a result, the: demand curve does not shift, and the supply curve shifts from S1 to S2. O demand curve shifts from D1 to D2 and the supply curve shifts from S1 to S2. demand curve shifts from D2 to D1 and the supply curve shifts from S2 to S1. demand curve shifts from D2 to D1 and the supply curve does not shift. S1 S2 D2 D1 Quantity Price
Step by Step Solution
3.44 Rating (141 Votes )
There are 3 Steps involved in it
Step: 1
option 3 is correct Demand CURVE will shift ...
Get Instant Access to Expert-Tailored Solutions
See step-by-step solutions with expert insights and AI powered tools for academic success
Step: 2

Step: 3

Ace Your Homework with AI
Get the answers you need in no time with our AI-driven, step-by-step assistance
Get StartedRecommended Textbook for
Introduction To Probability And Statistics
Authors: William Mendenhall, Robert Beaver, Barbara Beaver
14th Edition
1133103758, 978-1133103752
Students also viewed these Economics questions
Question
Answered: 1 week ago
Question
Answered: 1 week ago
Question
Answered: 1 week ago
Question
Answered: 1 week ago
Question
Answered: 1 week ago
Question
Answered: 1 week ago
Question
Answered: 1 week ago
Question
Answered: 1 week ago
Question
Answered: 1 week ago
Question
Answered: 1 week ago
Question
Answered: 1 week ago
Question
Answered: 1 week ago
Question
Answered: 1 week ago
Question
Answered: 1 week ago
Question
Answered: 1 week ago
Question
Answered: 1 week ago
Question
Answered: 1 week ago
Question
Answered: 1 week ago
Question
Answered: 1 week ago
Question
Answered: 1 week ago
Question
Answered: 1 week ago
Question
Answered: 1 week ago
View Answer in SolutionInn App


