Answered step by step
Verified Expert Solution
Question
1 Approved Answer
Salary($)110714Performance14Age45StudentApproval89.2Gender0School0 103756135381.811 105764106118100266607051048431618161416504836554585.782.869.789.277.71011111101 100705135485.601 781959286776675733091143777395270750151417201414144438483149333379.879.685.678.986.697.293.511000110101111 begin{tabular}{llllll} 10166 & 19 & 48 & 75.3 & 1 & 1 1 & & & & &
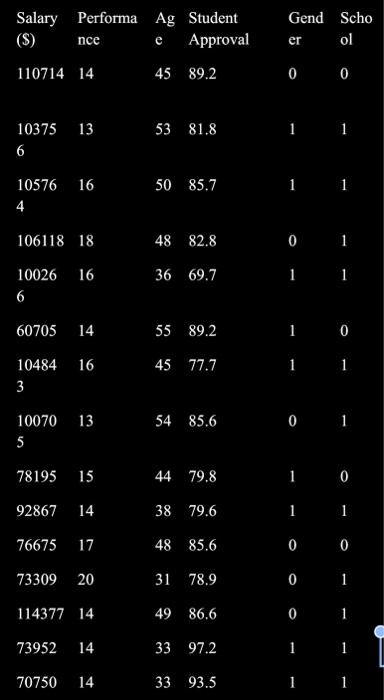
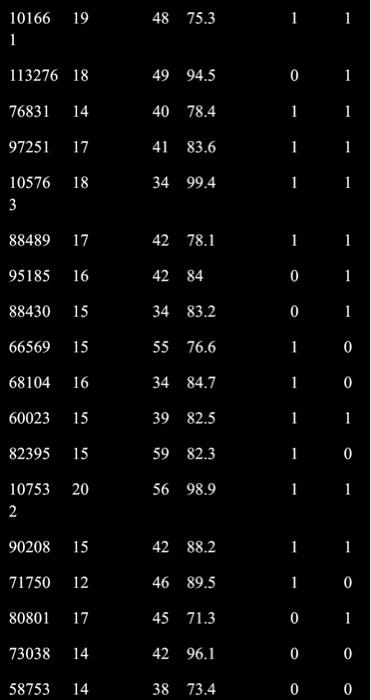
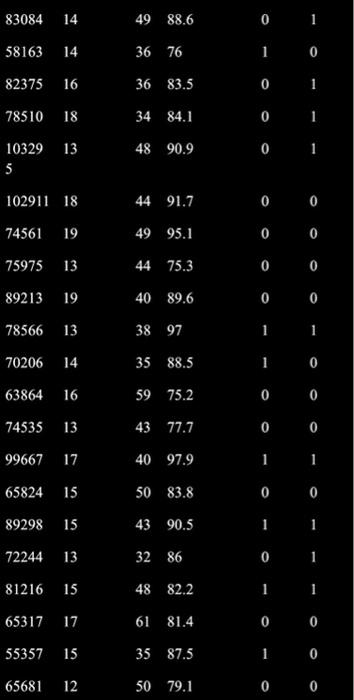
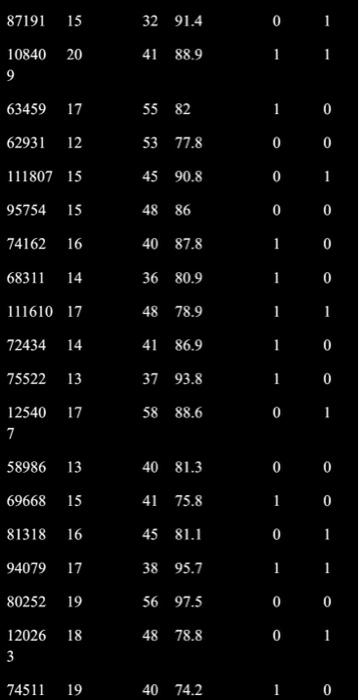
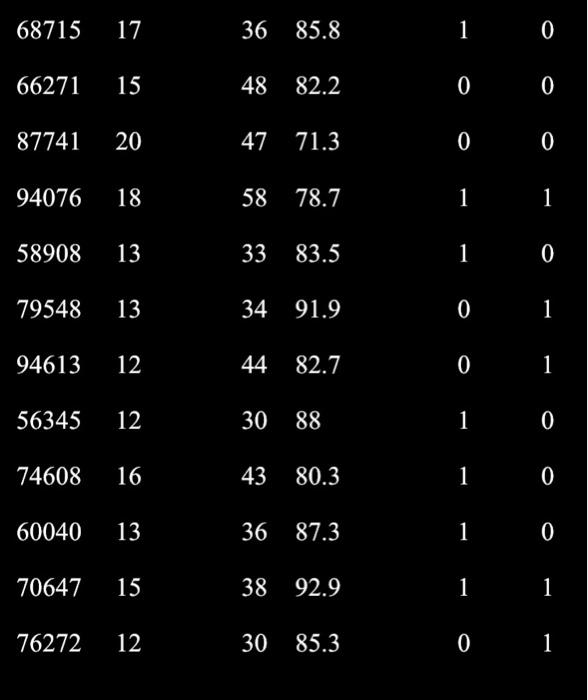
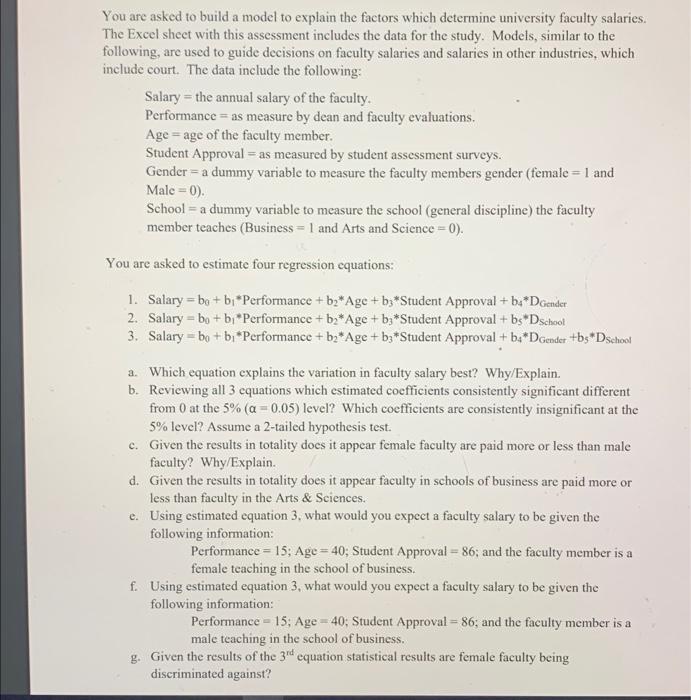 Salary($)110714Performance14Age45StudentApproval89.2Gender0School0 103756135381.811 105764106118100266607051048431618161416504836554585.782.869.789.277.71011111101 100705135485.601 781959286776675733091143777395270750151417201414144438483149333379.879.685.678.986.697.293.511000110101111 \begin{tabular}{llllll} 10166 & 19 & 48 & 75.3 & 1 & 1 \\ 1 & & & & & \\ 113276 & 18 & 49 & 94.5 & 0 & 1 \\ 76831 & 14 & 40 & 78.4 & 1 & 1 \\ 97251 & 17 & 41 & 83.6 & 1 & 1 \\ 10576 & 18 & 34 & 99.4 & 1 & 1 \\ 3 & & & & & \\ \hline 88489 & 17 & 42 & 78.1 & 1 & 1 \\ 95185 & 16 & 42 & 84 & 0 & 1 \\ 88430 & 15 & 34 & 83.2 & 0 & 1 \\ 66569 & 15 & 55 & 76.6 & 1 & 0 \\ 68104 & 16 & 34 & 84.7 & 1 & 0 \\ 60023 & 15 & 39 & 82.5 & 1 & 1 \\ \hline 82395 & 15 & 59 & 82.3 & 1 & 0 \\ \hline 10753 & 20 & 56 & 98.9 & 1 & 1 \\ 2 & & & & & \\ \hline 90208 & 15 & 42 & 88.2 & 1 & 1 \\ 71750 & 12 & 46 & 89.5 & 1 & 0 \\ \hline 80801 & 17 & 45 & 71.3 & 0 & 1 \\ \hline 73038 & 14 & 42 & 96.1 & 0 & 0 \\ \hline 58753 & 14 & 38 & 73.4 & 0 & 0 \end{tabular} \begin{tabular}{llllll} 83084 & 14 & 49 & 88.6 & 0 & 1 \\ 58163 & 14 & 36 & 76 & 1 & 0 \\ 82375 & 16 & 36 & 83.5 & 0 & 1 \\ 78510 & 18 & 34 & 84.1 & 0 & 1 \\ 10329 & 13 & 48 & 90.9 & 0 & 1 \\ 5 & & & & & \\ 102911 & 18 & 44 & 91.7 & 0 & 0 \\ 74561 & 19 & 49 & 95.1 & 0 & 0 \\ 75975 & 13 & 44 & 75.3 & 0 & 0 \\ 89213 & 19 & 40 & 89.6 & 0 & 0 \\ 78566 & 13 & 38 & 97 & 1 & 1 \\ 70206 & 14 & 35 & 88.5 & 1 & 0 \\ 63864 & 16 & 59 & 75.2 & 0 & 0 \\ 74535 & 13 & 43 & 77.7 & 0 & 0 \\ 99667 & 17 & 40 & 97.9 & 1 & 1 \\ 65824 & 15 & 50 & 83.8 & 0 & 0 \\ \hline 89298 & 15 & 43 & 90.5 & 1 & 1 \\ 72244 & 13 & 32 & 86 & 0 & 1 \\ \hline 81216 & 15 & 48 & 82.2 & 1 & 1 \\ 65317 & 17 & 61 & 81.4 & 0 & 0 \\ \hline 65681 & 12 & 50 & 79.1 & 0 & 0 \end{tabular} \begin{tabular}{llllll} 87191 & 15 & 32 & 91.4 & 0 & 1 \\ 10840 & 20 & 41 & 88.9 & 1 & 1 \\ 9 & & & & & \\ 63459 & 17 & 55 & 82 & 1 & 0 \\ 62931 & 12 & 53 & 77.8 & 0 & 0 \\ 111807 & 15 & 45 & 90.8 & 0 & 1 \\ 95754 & 15 & 48 & 86 & 0 & 0 \\ 74162 & 16 & 40 & 87.8 & 1 & 0 \\ 68311 & 14 & 36 & 80.9 & 1 & 0 \\ 111610 & 17 & 48 & 78.9 & 1 & 1 \\ 72434 & 14 & 41 & 86.9 & 1 & 0 \\ 75522 & 13 & 37 & 93.8 & 1 & 0 \\ 12540 & 17 & 58 & 88.6 & 0 & 1 \\ 7 & & & & & 0 \\ \hline 58986 & 13 & 40 & 81.3 & 0 & 0 \\ 69668 & 15 & 41 & 75.8 & 1 & 0 \\ \hline 81318 & 16 & 45 & 81.1 & 0 & 1 \\ 94079 & 17 & 38 & 95.7 & 1 & 1 \\ 80252 & 19 & 56 & 97.5 & 0 & 0 \\ \hline 74511 & 19 & 40 & 74.2 & 1 & 0 \end{tabular} \begin{tabular}{llllll} 68715 & 17 & 36 & 85.8 & 1 & 0 \\ \hline 66271 & 15 & 48 & 82.2 & 0 & 0 \\ 87741 & 20 & 47 & 71.3 & 0 & 0 \\ 94076 & 18 & 58 & 78.7 & 1 & 1 \\ \hline 58908 & 13 & 33 & 83.5 & 1 & 0 \\ 79548 & 13 & 34 & 91.9 & 0 & 1 \\ \hline 94613 & 12 & 44 & 82.7 & 0 & 1 \\ \hline 56345 & 12 & 30 & 88 & 1 & 0 \\ \hline 74608 & 16 & 43 & 80.3 & 1 & 0 \\ 60040 & 13 & 36 & 87.3 & 1 & 0 \\ \hline 70647 & 15 & 38 & 92.9 & 1 & 1 \\ 76272 & 12 & 30 & 85.3 & 0 & 1 \end{tabular} You are asked to build a model to explain the factors which determine university faculty salaries. The Excel sheet with this assessment includes the data for the study. Models, similar to the following, are used to guide decisions on faculty salaries and salaries in other industries, which include court. The data include the following: Salary = the annual salary of the faculty. Performance = as measure by dean and faculty evaluations. Age = age of the faculty member. Student Approval = as measured by student assessment surveys. Gender = a dummy variable to measure the faculty members gender (female =1 and Male =0 ). School = a dummy variable to measure the school (general discipline) the faculty member teaches (Business =1 and Arts and Science =0 ). You are asked to estimate four regression equations: 1. Salary =b0+b1 Performance +b2Age+b3 Student Approval +b4DGender 2. Salary =b0+b1 Performance +b2Age+b3 Student Approval +b5Dschool 3. Salary =b0+b1 Performance +b2Age+b3 Student Approval +b4DGender+b5Dsehool a. Which equation explains the variation in faculty salary best? Why/Explain. b. Revicwing all 3 equations which estimated coefficients consistently significant different from 0 at the 5%(=0.05) level? Which coefficients are consistently insignificant at the 5% level? Assume a 2-tailed hypothesis test. c. Given the results in totality does it appear female faculty are paid more or less than male faculty? Why/Explain. d. Given the results in totality does it appear faculty in schools of business are paid more or less than faculty in the Arts \& Sciences. e. Using estimated equation 3, what would you expect a faculty salary to be given the following information: Performance =15;Age=40; Student Approval =86; and the faculty member is a female teaching in the school of business. f. Using estimated equation 3, what would you expect a faculty salary to be given the following information: Performance =15; Age =40; Student Approval =86; and the faculty member is a male teaching in the school of business. g. Given the results of the 3rd equation statistical results are female faculty being discriminated against? Salary($)110714Performance14Age45StudentApproval89.2Gender0School0 103756135381.811 105764106118100266607051048431618161416504836554585.782.869.789.277.71011111101 100705135485.601 781959286776675733091143777395270750151417201414144438483149333379.879.685.678.986.697.293.511000110101111 \begin{tabular}{llllll} 10166 & 19 & 48 & 75.3 & 1 & 1 \\ 1 & & & & & \\ 113276 & 18 & 49 & 94.5 & 0 & 1 \\ 76831 & 14 & 40 & 78.4 & 1 & 1 \\ 97251 & 17 & 41 & 83.6 & 1 & 1 \\ 10576 & 18 & 34 & 99.4 & 1 & 1 \\ 3 & & & & & \\ \hline 88489 & 17 & 42 & 78.1 & 1 & 1 \\ 95185 & 16 & 42 & 84 & 0 & 1 \\ 88430 & 15 & 34 & 83.2 & 0 & 1 \\ 66569 & 15 & 55 & 76.6 & 1 & 0 \\ 68104 & 16 & 34 & 84.7 & 1 & 0 \\ 60023 & 15 & 39 & 82.5 & 1 & 1 \\ \hline 82395 & 15 & 59 & 82.3 & 1 & 0 \\ \hline 10753 & 20 & 56 & 98.9 & 1 & 1 \\ 2 & & & & & \\ \hline 90208 & 15 & 42 & 88.2 & 1 & 1 \\ 71750 & 12 & 46 & 89.5 & 1 & 0 \\ \hline 80801 & 17 & 45 & 71.3 & 0 & 1 \\ \hline 73038 & 14 & 42 & 96.1 & 0 & 0 \\ \hline 58753 & 14 & 38 & 73.4 & 0 & 0 \end{tabular} \begin{tabular}{llllll} 83084 & 14 & 49 & 88.6 & 0 & 1 \\ 58163 & 14 & 36 & 76 & 1 & 0 \\ 82375 & 16 & 36 & 83.5 & 0 & 1 \\ 78510 & 18 & 34 & 84.1 & 0 & 1 \\ 10329 & 13 & 48 & 90.9 & 0 & 1 \\ 5 & & & & & \\ 102911 & 18 & 44 & 91.7 & 0 & 0 \\ 74561 & 19 & 49 & 95.1 & 0 & 0 \\ 75975 & 13 & 44 & 75.3 & 0 & 0 \\ 89213 & 19 & 40 & 89.6 & 0 & 0 \\ 78566 & 13 & 38 & 97 & 1 & 1 \\ 70206 & 14 & 35 & 88.5 & 1 & 0 \\ 63864 & 16 & 59 & 75.2 & 0 & 0 \\ 74535 & 13 & 43 & 77.7 & 0 & 0 \\ 99667 & 17 & 40 & 97.9 & 1 & 1 \\ 65824 & 15 & 50 & 83.8 & 0 & 0 \\ \hline 89298 & 15 & 43 & 90.5 & 1 & 1 \\ 72244 & 13 & 32 & 86 & 0 & 1 \\ \hline 81216 & 15 & 48 & 82.2 & 1 & 1 \\ 65317 & 17 & 61 & 81.4 & 0 & 0 \\ \hline 65681 & 12 & 50 & 79.1 & 0 & 0 \end{tabular} \begin{tabular}{llllll} 87191 & 15 & 32 & 91.4 & 0 & 1 \\ 10840 & 20 & 41 & 88.9 & 1 & 1 \\ 9 & & & & & \\ 63459 & 17 & 55 & 82 & 1 & 0 \\ 62931 & 12 & 53 & 77.8 & 0 & 0 \\ 111807 & 15 & 45 & 90.8 & 0 & 1 \\ 95754 & 15 & 48 & 86 & 0 & 0 \\ 74162 & 16 & 40 & 87.8 & 1 & 0 \\ 68311 & 14 & 36 & 80.9 & 1 & 0 \\ 111610 & 17 & 48 & 78.9 & 1 & 1 \\ 72434 & 14 & 41 & 86.9 & 1 & 0 \\ 75522 & 13 & 37 & 93.8 & 1 & 0 \\ 12540 & 17 & 58 & 88.6 & 0 & 1 \\ 7 & & & & & 0 \\ \hline 58986 & 13 & 40 & 81.3 & 0 & 0 \\ 69668 & 15 & 41 & 75.8 & 1 & 0 \\ \hline 81318 & 16 & 45 & 81.1 & 0 & 1 \\ 94079 & 17 & 38 & 95.7 & 1 & 1 \\ 80252 & 19 & 56 & 97.5 & 0 & 0 \\ \hline 74511 & 19 & 40 & 74.2 & 1 & 0 \end{tabular} \begin{tabular}{llllll} 68715 & 17 & 36 & 85.8 & 1 & 0 \\ \hline 66271 & 15 & 48 & 82.2 & 0 & 0 \\ 87741 & 20 & 47 & 71.3 & 0 & 0 \\ 94076 & 18 & 58 & 78.7 & 1 & 1 \\ \hline 58908 & 13 & 33 & 83.5 & 1 & 0 \\ 79548 & 13 & 34 & 91.9 & 0 & 1 \\ \hline 94613 & 12 & 44 & 82.7 & 0 & 1 \\ \hline 56345 & 12 & 30 & 88 & 1 & 0 \\ \hline 74608 & 16 & 43 & 80.3 & 1 & 0 \\ 60040 & 13 & 36 & 87.3 & 1 & 0 \\ \hline 70647 & 15 & 38 & 92.9 & 1 & 1 \\ 76272 & 12 & 30 & 85.3 & 0 & 1 \end{tabular} You are asked to build a model to explain the factors which determine university faculty salaries. The Excel sheet with this assessment includes the data for the study. Models, similar to the following, are used to guide decisions on faculty salaries and salaries in other industries, which include court. The data include the following: Salary = the annual salary of the faculty. Performance = as measure by dean and faculty evaluations. Age = age of the faculty member. Student Approval = as measured by student assessment surveys. Gender = a dummy variable to measure the faculty members gender (female =1 and Male =0 ). School = a dummy variable to measure the school (general discipline) the faculty member teaches (Business =1 and Arts and Science =0 ). You are asked to estimate four regression equations: 1. Salary =b0+b1 Performance +b2Age+b3 Student Approval +b4DGender 2. Salary =b0+b1 Performance +b2Age+b3 Student Approval +b5Dschool 3. Salary =b0+b1 Performance +b2Age+b3 Student Approval +b4DGender+b5Dsehool a. Which equation explains the variation in faculty salary best? Why/Explain. b. Revicwing all 3 equations which estimated coefficients consistently significant different from 0 at the 5%(=0.05) level? Which coefficients are consistently insignificant at the 5% level? Assume a 2-tailed hypothesis test. c. Given the results in totality does it appear female faculty are paid more or less than male faculty? Why/Explain. d. Given the results in totality does it appear faculty in schools of business are paid more or less than faculty in the Arts \& Sciences. e. Using estimated equation 3, what would you expect a faculty salary to be given the following information: Performance =15;Age=40; Student Approval =86; and the faculty member is a female teaching in the school of business. f. Using estimated equation 3, what would you expect a faculty salary to be given the following information: Performance =15; Age =40; Student Approval =86; and the faculty member is a male teaching in the school of business. g. Given the results of the 3rd equation statistical results are female faculty being discriminated against
Step by Step Solution
There are 3 Steps involved in it
Step: 1

Get Instant Access to Expert-Tailored Solutions
See step-by-step solutions with expert insights and AI powered tools for academic success
Step: 2

Step: 3
Ace Your Homework with AI
Get the answers you need in no time with our AI-driven, step-by-step assistance
Get Started