Answered step by step
Verified Expert Solution
Question
1 Approved Answer
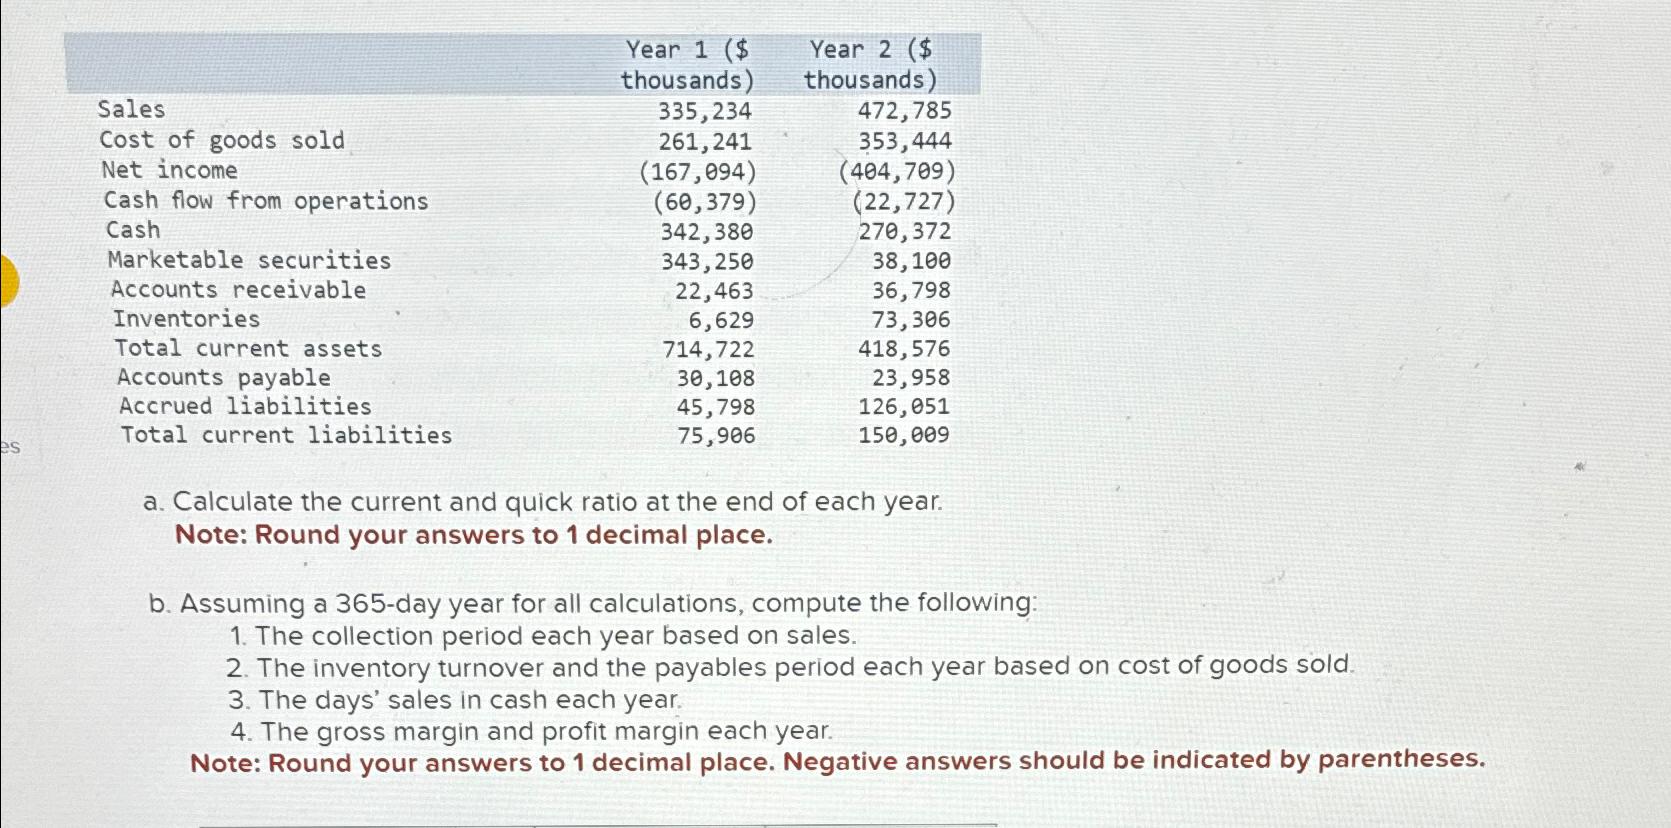
Sales 335,234 Year 1 ($ thousands) Year 2 ($ thousands) 472,785 Cost of goods sold 261,241 353,444 Net income (167,094) (404,709) Cash flow from

Sales 335,234 Year 1 ($ thousands) Year 2 ($ thousands) 472,785 Cost of goods sold 261,241 353,444 Net income (167,094) (404,709) Cash flow from operations (60,379) (22,727) Cash 342,380 270,372 Marketable securities 343,250 38,100 Accounts receivable Inventories Total current assets Accounts payable Accrued liabilities Total current liabilities es 22,463 36,798 6,629 73,306 714,722 418,576 30,108 23,958 45,798 126,051 75,906 150,009 a. Calculate the current and quick ratio at the end of each year. Note: Round your answers to 1 decimal place. b. Assuming a 365-day year for all calculations, compute the following: 1. The collection period each year based on sales. 2. The inventory turnover and the payables period each year based on cost of goods sold. 3. The days' sales in cash each year. 4. The gross margin and profit margin each year. Note: Round your answers to 1 decimal place. Negative answers should be indicated by parentheses.
Step by Step Solution
There are 3 Steps involved in it
Step: 1

Get Instant Access to Expert-Tailored Solutions
See step-by-step solutions with expert insights and AI powered tools for academic success
Step: 2

Step: 3

Ace Your Homework with AI
Get the answers you need in no time with our AI-driven, step-by-step assistance
Get Started


