

Answered step by step
Verified Expert Solution
Question
1 Approved Answer
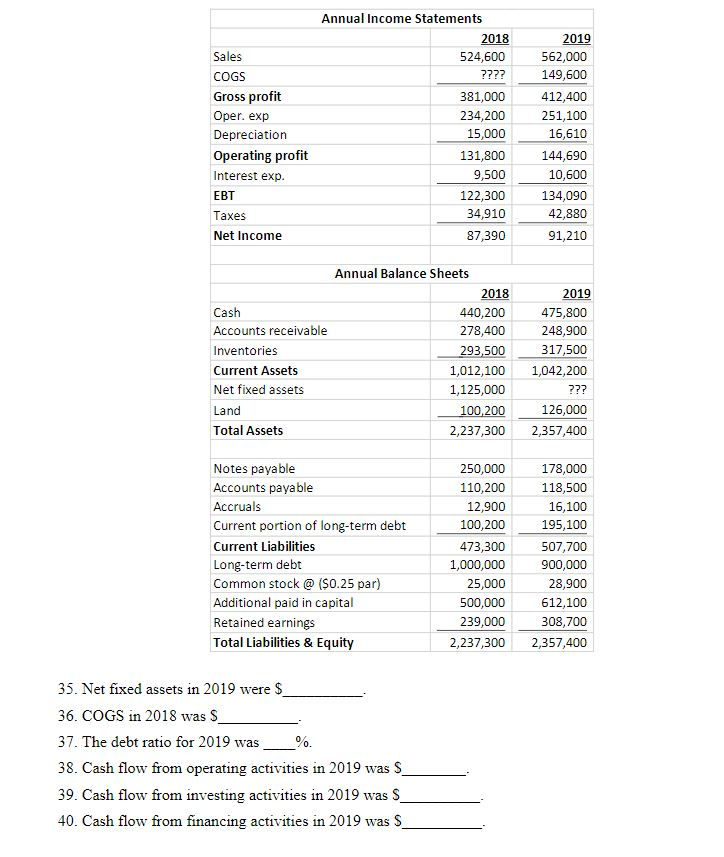
Sales COGS Gross profit Oper. exp Depreciation Operating profit Interest exp. EBT Taxes Net Income Annual Income Statements 2018 524,600 ???? 381,000 234,200 15,000 131,800
Step by Step Solution
There are 3 Steps involved in it
Step: 1

Get Instant Access to Expert-Tailored Solutions
See step-by-step solutions with expert insights and AI powered tools for academic success
Step: 2

Step: 3
Ace Your Homework with AI
Get the answers you need in no time with our AI-driven, step-by-step assistance
Get Started
The Complete Guide To Investing In Commodity Trading And Futures How To Earn High Rates Of Returns Safely
Authors: Mary P Holihan
1st Edition
1601380038, 978-1601380036