Answered step by step
Verified Expert Solution
Question
1 Approved Answer
Sales for the past seven years along with the EBITDA (Earnings before interest, tax and depreciation) have been given in the following graph: Revenue $400M
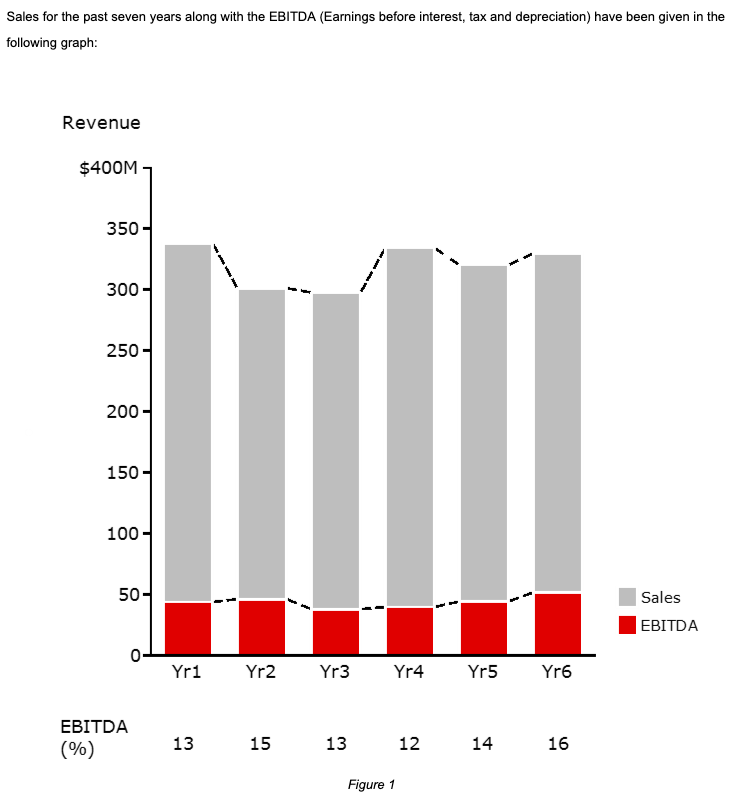
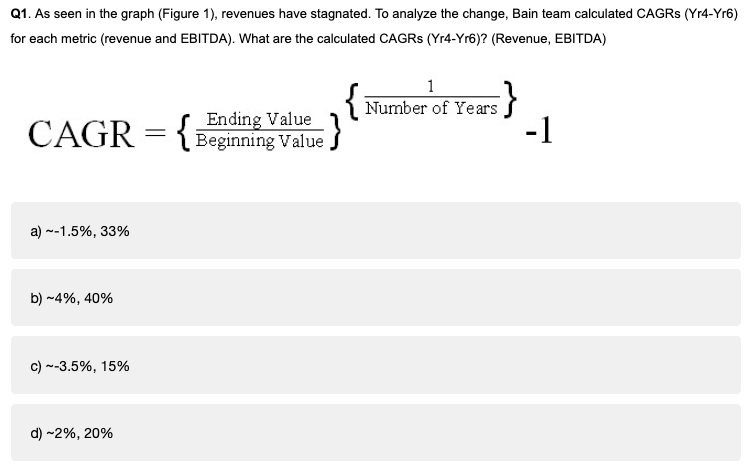
Sales for the past seven years along with the EBITDA (Earnings before interest, tax and depreciation) have been given in the following graph: Revenue $400M 350 300 250 200 150 100 50 Sales EBITDA Yr1 Yr2 Yr3 Yr4 Yr5 Yr6 EBITDA 13 15 13 12 14 16 (%) Figure 1 LO Ln Q1. As seen in the graph (Figure 1), revenues have stagnated. To analyze the change, Bain team calculated CAGRS (Yr4-Yr6) for each metric (revenue and EBITDA). What are the calculated CAGRs (Yr4-Yr6)? (Revenue, EBITDA) 1 { Ending Value Beginning Value Number of Years -1 CAGR { a)-1.5%, 33% b) 4%, 40% c)3.5%, 15% d) 2%, 20%
Step by Step Solution
There are 3 Steps involved in it
Step: 1
Get Instant Access to Expert-Tailored Solutions
See step-by-step solutions with expert insights and AI powered tools for academic success
Step: 2
Step: 3
Ace Your Homework with AI
Get the answers you need in no time with our AI-driven, step-by-step assistance
Get Started