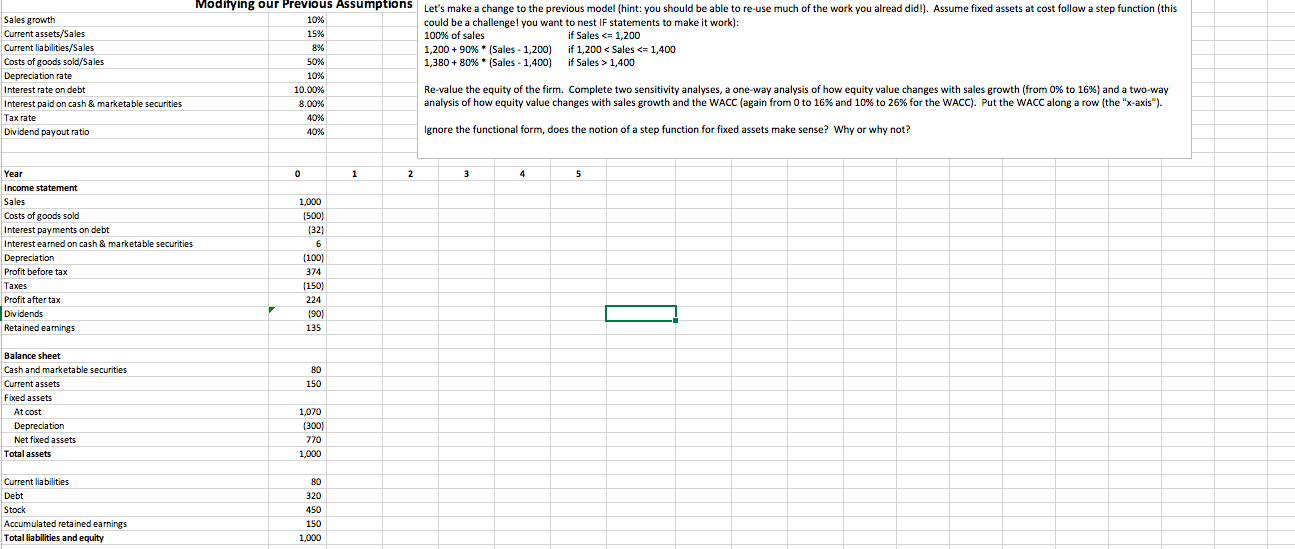
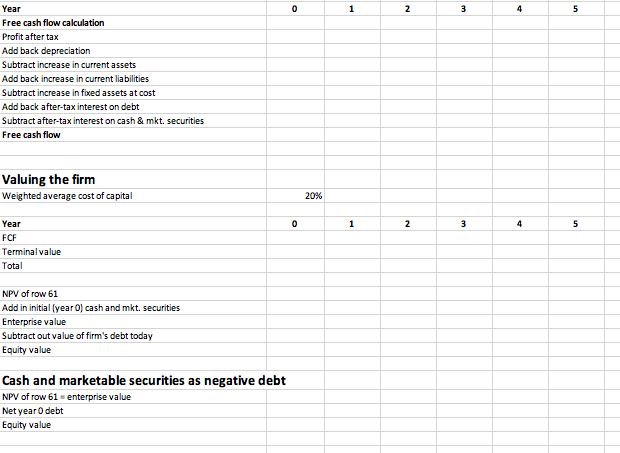
Sales growth Current assets/Sales Current liabilities/Sales Costs of goods sold/Sales Depreciation rate Interest rate on debt Interest paid on cash & marketable securities Tax rate Dividend payout ratio Modifying our Previous Assumptions Let's make a change to the previous model (hint: you should be able to re-use much of the work you alread did!). Assume fixed assets at cost follow a step function (this could be a challenge! you want to nest IF statements to make it work): 100% of sales if Sales 1,400 Re-value the equity of the firm. Complete two sensitivity analyses, a one-way analysis of how equity value changes with sales growth (from 0% to 16%) and a two-way analysis of how equity value changes with sales growth and the WACC (again from 0 to 16% and 10% to 26% for the WACC). Put the WACC along a row (the "x-axis"). 10% 15% 8% 50% 10% 10.00% 8.00% 40% 40% Ignore the functional form, does the notion of a step function for fixed assets make sense? Why or why not? 0 1 2 3 4 5 Year Income statement Sales Costs of goods sold Interest payments on debt Interest earned on cash & marketable securities Depreciation Profit before tax Taxes Profit after tax Dividends Retained earnings 1,000 (500) 132) 6 6 (100) 374 (150) 224 190) 135 80 150 Balance sheet Cash and marketable securities Current assets Fixed assets At cost Depreciation Net fixed assets Total assets 1,070 (300) 770 1,000 Current liabilities Debt Stock Accumulated retained earnings Total liabilities and equity 80 320 450 150 1,000 Year 1 2 5 Free cash flow calculation Profit after tax Add back depreciation Subtract increase in current assets Add back increase in current liabilities Subtract increase in fixed assets at cost Add back after-tax interest on debt Subtract after-tax interest on cash & mkt. Securities Free cash flow Valuing the firm Weighted average cost of capital 20% 0 1 2 3 4 5 Year FCF Terminal value Total NPV of row 61 Add in initial (year O) cash and mkt. securities Enterprise value Subtract out value of firm's debt today Equity value Cash and marketable securities as negative debt NPV of row 61 enterprise value Net year0 debt Equity value Sales growth Current assets/Sales Current liabilities/Sales Costs of goods sold/Sales Depreciation rate Interest rate on debt Interest paid on cash & marketable securities Tax rate Dividend payout ratio Modifying our Previous Assumptions Let's make a change to the previous model (hint: you should be able to re-use much of the work you alread did!). Assume fixed assets at cost follow a step function (this could be a challenge! you want to nest IF statements to make it work): 100% of sales if Sales 1,400 Re-value the equity of the firm. Complete two sensitivity analyses, a one-way analysis of how equity value changes with sales growth (from 0% to 16%) and a two-way analysis of how equity value changes with sales growth and the WACC (again from 0 to 16% and 10% to 26% for the WACC). Put the WACC along a row (the "x-axis"). 10% 15% 8% 50% 10% 10.00% 8.00% 40% 40% Ignore the functional form, does the notion of a step function for fixed assets make sense? Why or why not? 0 1 2 3 4 5 Year Income statement Sales Costs of goods sold Interest payments on debt Interest earned on cash & marketable securities Depreciation Profit before tax Taxes Profit after tax Dividends Retained earnings 1,000 (500) 132) 6 6 (100) 374 (150) 224 190) 135 80 150 Balance sheet Cash and marketable securities Current assets Fixed assets At cost Depreciation Net fixed assets Total assets 1,070 (300) 770 1,000 Current liabilities Debt Stock Accumulated retained earnings Total liabilities and equity 80 320 450 150 1,000 Year 1 2 5 Free cash flow calculation Profit after tax Add back depreciation Subtract increase in current assets Add back increase in current liabilities Subtract increase in fixed assets at cost Add back after-tax interest on debt Subtract after-tax interest on cash & mkt. Securities Free cash flow Valuing the firm Weighted average cost of capital 20% 0 1 2 3 4 5 Year FCF Terminal value Total NPV of row 61 Add in initial (year O) cash and mkt. securities Enterprise value Subtract out value of firm's debt today Equity value Cash and marketable securities as negative debt NPV of row 61 enterprise value Net year0 debt Equity value