Answered step by step
Verified Expert Solution
Question
1 Approved Answer
Sales will increase for the next quarter by the same percentage increase from the previous quarter to the last reported quarter. For example, if sales
Sales will increase for the next quarter by the same percentage increase from the previous quarter to the last reported quarter. For example, if sales increased from the last quarter to the current reported quarter, you will use as the sales increase for your pro formas.
Calculate the expenses to determine what will change and what will remain the same.Note: Not all costs are associated with the cost of sales. It will be up to you to determine which line items need to be increased and which ones need to be left alone. This will require you to distinguish between fixed and variable costs.Within each line item expense explain your rationale, as well as provide a brief summary.Then,
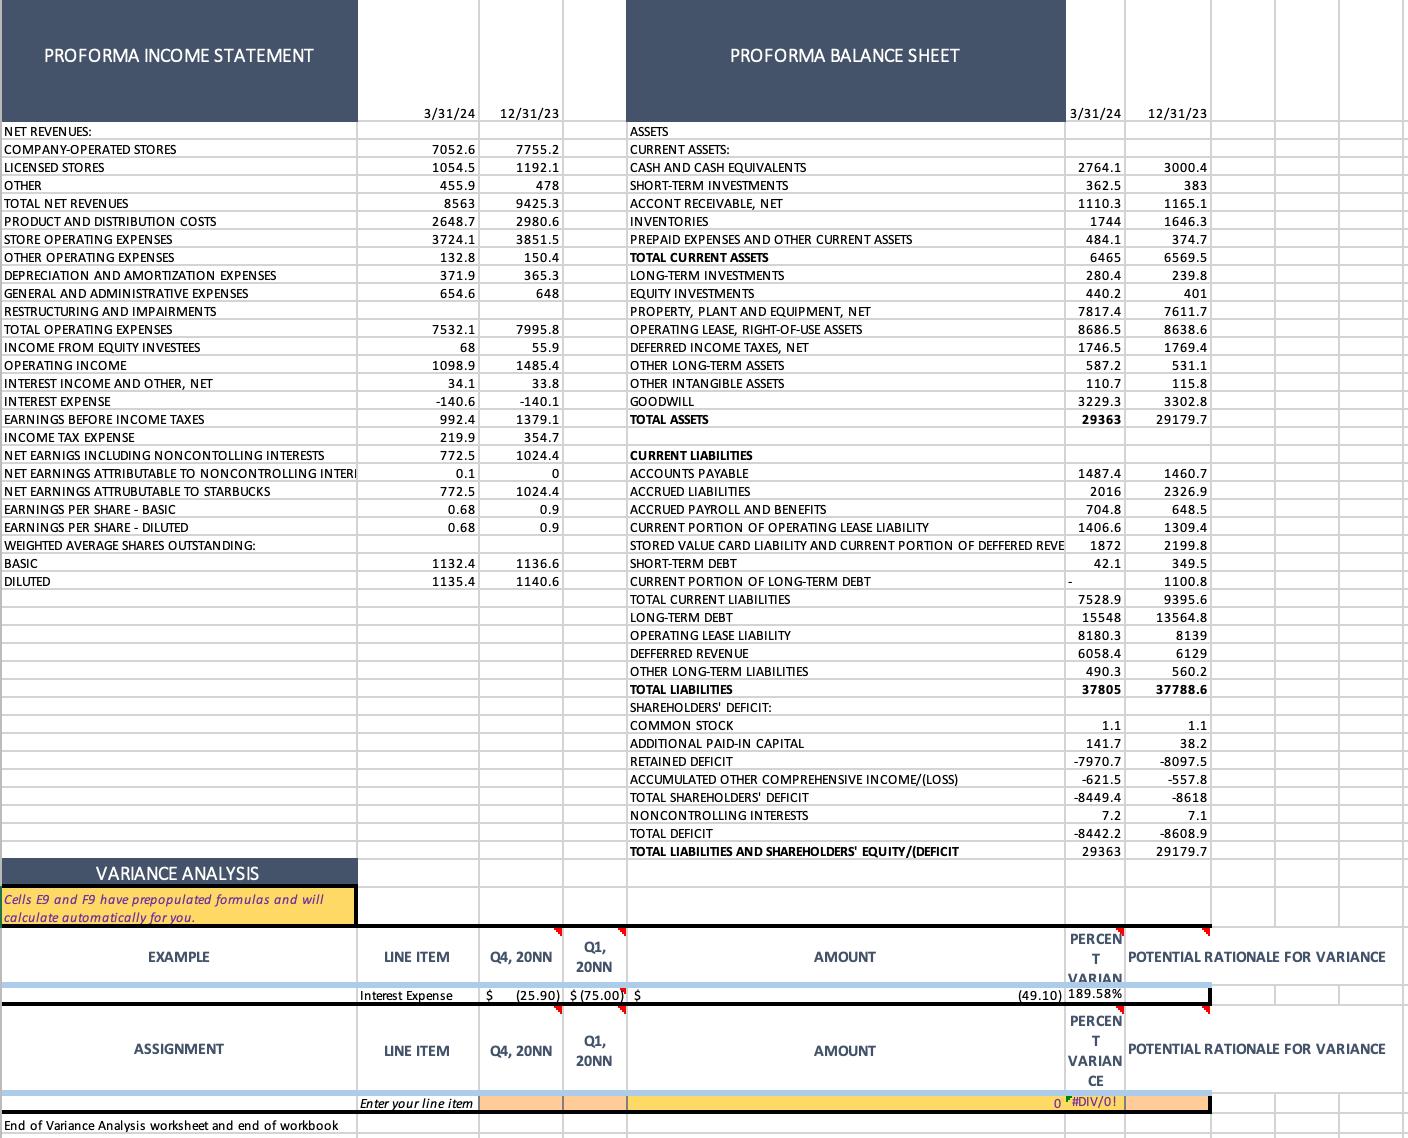
calculate a quarterly variance analysis using the Variance Analysis tab of the Financial Forecasting Template the same template you used for Part
Complete the following in your variance analysis:
In the Excel template, insert the line items
. In Column CQNN enter the previous quarters numbers as the budget.
In Column DQNN enter the current quarters actual numbers.
In Column E the spreadsheet will calculate the dollar difference between the budget and actual numbers.
In Column F the spreadsheet will calculate the percentage change.
In Column G analyze and speculate the rationale for the variances.

PROFORMA INCOME STATEMENT PROFORMA BALANCE SHEET 7532.1 7995.8 68 1098.91 55.9 1485.4 34.1 33.8 -140.6 -140.1 EARNINGS BEFORE INCOME TAXES 992.4 1379.1 3/31/24 12/31/23 3/31/24 12/31/23 NET REVENUES: COMPANY-OPERATED STORES LICENSED STORES OTHER TOTAL NET REVENUES 7052.6 1054.5 455.9 7755.2 1192.1 ASSETS CURRENT ASSETS: CASH AND CASH EQUIVALENTS 478 SHORT-TERM INVESTMENTS 2764.1 362.5 3000.4 383 8563 9425.3 ACCONT RECEIVABLE, NET 1110.3 1165.1 PRODUCT AND DISTRIBUTION COSTS 2648.7 2980.6 INVENTORIES 1744 1646.3 STORE OPERATING EXPENSES 3724.1 3851.5 PREPAID EXPENSES AND OTHER CURRENT ASSETS 484.1 374.7 OTHER OPERATING EXPENSES 132.8 150.4 TOTAL CURRENT ASSETS 6465 6569.5 DEPRECIATION AND AMORTIZATION EXPENSES 371.9 365.3 LONG-TERM INVESTMENTS 280.4 239.8 GENERAL AND ADMINISTRATIVE EXPENSES 654.6 648 EQUITY INVESTMENTS 440.2 401 RESTRUCTURING AND IMPAIRMENTS PROPERTY, PLANT AND EQUIPMENT, NET 7817.4 7611.7 TOTAL OPERATING EXPENSES OPERATING LEASE, RIGHT-OF-USE ASSETS 8686.5 8638.6 INCOME FROM EQUITY INVESTEES DEFERRED INCOME TAXES, NET 1746.5 1769.4 OPERATING INCOME INTEREST INCOME AND OTHER, NET INTEREST EXPENSE OTHER LONG-TERM ASSETS OTHER INTANGIBLE ASSETS GOODWILL TOTAL ASSETS 587.2 531.1 110.7 115.8 3229.3 29363 3302.8. 29179.7 INCOME TAX EXPENSE 219.9 354.7 NET EARNIGS INCLUDING NONCONTOLLING INTERESTS 772.5 1024.4 CURRENT LIABILITIES NET EARNINGS ATTRIBUTABLE TO NONCONTROLLING INTERI 0.1 0 ACCOUNTS PAYABLE 1487.4 1460.7 NET EARNINGS ATTRUBUTABLE TO STARBUCKS 772.5 1024.4 ACCRUED LIABILITIES 2016 2326.9 EARNINGS PER SHARE - BASIC EARNINGS PER SHARE - DILUTED WEIGHTED AVERAGE SHARES OUTSTANDING: BASIC DILUTED 0.68 0.9 ACCRUED PAYROLL AND BENEFITS 704.8 648.5 0.68 0.9 CURRENT PORTION OF OPERATING LEASE LIABILITY 1406.6 1309.4 STORED VALUE CARD LIABILITY AND CURRENT PORTION OF DEFFERED REVE 1872 2199.8 1132.4 1135.4 1136.6 SHORT-TERM DEBT 42.1 349.5 1140.6 CURRENT PORTION OF LONG-TERM DEBT 1100.8 TOTAL CURRENT LIABILITIES 7528.9 9395.6 LONG-TERM DEBT 15548 13564.8 OPERATING LEASE LIABILITY 8180.3 8139 DEFFERRED REVENUE OTHER LONG-TERM LIABILITIES TOTAL LIABILITIES 6058.4 6129 490.3 37805 560.2 37788.6 VARIANCE ANALYSIS Cells E9 and F9 have prepopulated formulas and will calculate automatically for you. EXAMPLE ASSIGNMENT SHAREHOLDERS' DEFICIT: COMMON STOCK ADDITIONAL PAID-IN CAPITAL 1.1. 141.7 RETAINED DEFICIT -7970.7 1.1 38.2 -8097.5 ACCUMULATED OTHER COMPREHENSIVE INCOME/(LOSS) -621.5 -557.8 TOTAL SHAREHOLDERS' DEFICIT -8449.4 -8618 NONCONTROLLING INTERESTS 7.2 TOTAL DEFICIT -8442.2 TOTAL LIABILITIES AND SHAREHOLDERS' EQUITY/(DEFICIT 29363 7.1 -8608.9 29179.7 LINE ITEM Q4, 20NN Q1, 20NN AMOUNT Interest Expense $ (25.90) $ (75.00 $ LINE ITEM Q4, 20NN Q1, 20NN Enter your line item End of Variance Analysis worksheet and end of workbook AMOUNT PERCEN T VARIAN POTENTIAL RATIONALE FOR VARIANCE (49.10) 189.58% PERCEN T VARIAN POTENTIAL RATIONALE FOR VARIANCE CE 0 #DIV/O!
Step by Step Solution
There are 3 Steps involved in it
Step: 1

Get Instant Access to Expert-Tailored Solutions
See step-by-step solutions with expert insights and AI powered tools for academic success
Step: 2

Step: 3

Ace Your Homework with AI
Get the answers you need in no time with our AI-driven, step-by-step assistance
Get Started


