

Answered step by step
Verified Expert Solution
Question
1 Approved Answer
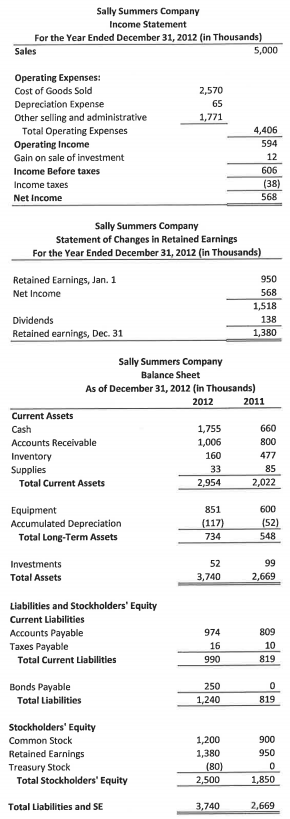
Sally Summers Company Income Statement For the Year Ended December 31, 2012 (in Thousands) Sales 5,000 2,570 65 1,771 Operating Expenses: Cost of Goods Sold
Step by Step Solution
There are 3 Steps involved in it
Step: 1

Get Instant Access to Expert-Tailored Solutions
See step-by-step solutions with expert insights and AI powered tools for academic success
Step: 2

Step: 3
Ace Your Homework with AI
Get the answers you need in no time with our AI-driven, step-by-step assistance
Get Started
Corporate Financial Reporting Text And Cases
Authors: E. Richard Brownlee, Kenneth R. Ferris, Mark E. Haskins
1st Edition
0256071942, 978-0256071948