Answered step by step
Verified Expert Solution
Question
1 Approved Answer
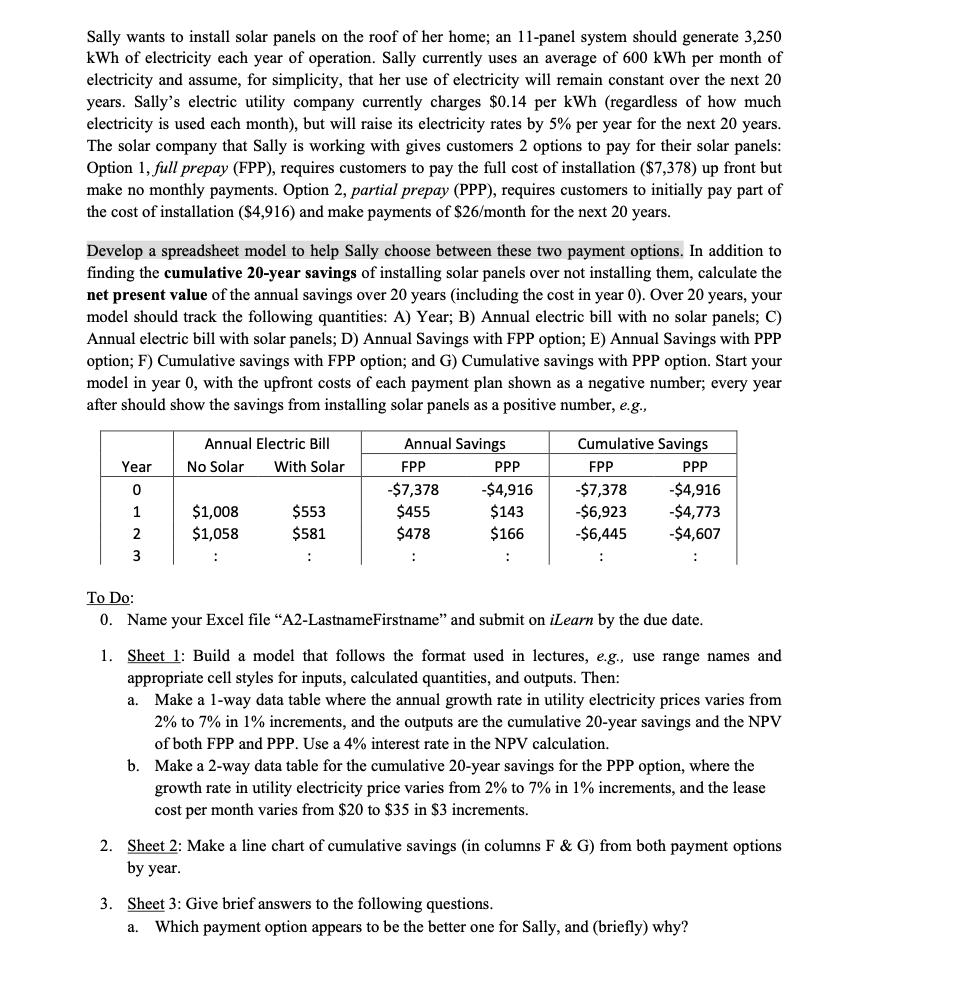
Sally wants to install solar panels on the roof of her home; an 11-panel system should generate 3,250 kWh of electricity each year of

Sally wants to install solar panels on the roof of her home; an 11-panel system should generate 3,250 kWh of electricity each year of operation. Sally currently uses an average of 600 kWh per month of electricity and assume, for simplicity, that her use of electricity will remain constant over the next 20 years. Sally's electric utility company currently charges $0.14 per kWh (regardless of how much electricity is used each month), but will raise its electricity rates by 5% per year for the next 20 years. The solar company that Sally is working with gives customers 2 options to pay for their solar panels: Option 1, full prepay (FPP), requires customers to pay the full cost of installation ($7,378) up front but make no monthly payments. Option 2, partial prepay (PPP), requires customers to initially pay part of the cost of installation ($4,916) and make payments of $26/month for the next 20 years. Develop a spreadsheet model to help Sally choose between these two payment options. In addition to finding the cumulative 20-year savings of installing solar panels over not installing them, calculate the net present value of the annual savings over 20 years (including the cost in year 0). Over 20 years, your model should track the following quantities: A) Year; B) Annual electric bill with no solar panels; C) Annual electric bill with solar panels; D) Annual Savings with FPP option; E) Annual Savings with PPP option; F) Cumulative savings with FPP option; and G) Cumulative savings with PPP option. Start your model in year 0, with the upfront costs of each payment plan shown as a negative number; every year after should show the savings from installing solar panels as a positive number, e.g., Year 0 3 Annual Electric Bill No Solar With Solar $1,008 $1,058 $553 $581 : Annual Savings FPP -$7,378 $455 $478 : PPP -$4,916 $143 $166 : Cumulative Savings FPP PPP -$7,378 -$4,916 -$6,923 -$4,773 -$6,445 -$4,607 : : To Do: 0. Name your Excel file "A2-LastnameFirstname" and submit on iLearn by the due date. 1. Sheet 1: Build a model that follows the format used in lectures, e.g., use range names and appropriate cell styles for inputs, calculated quantities, and outputs. Then: a. Make a 1-way data table where the annual growth rate in utility electricity prices varies from 2% to 7% in 1% increments, and the outputs are the cumulative 20-year savings and the NPV of both FPP and PPP. Use a 4% interest rate in the NPV calculation. b. Make a 2-way data table for the cumulative 20-year savings for the PPP option, where the growth rate in utility electricity price varies from 2% to 7% in 1% increments, and the lease cost per month varies from $20 to $35 in $3 increments. 2. Sheet 2: Make a line chart of cumulative savings (in columns F & G) from both payment options by year. 3. Sheet 3: Give brief answers to the following questions. a. Which payment option appears to be the better one for Sally, and (briefly) why?
Step by Step Solution
★★★★★
3.45 Rating (161 Votes )
There are 3 Steps involved in it
Step: 1
To help Sally choose between the two payment options for installing solar panels we can develop a spreadsheet model that calculates the cumulative savings over 20 years and the net present value NPV o...
Get Instant Access to Expert-Tailored Solutions
See step-by-step solutions with expert insights and AI powered tools for academic success
Step: 2

Step: 3

Ace Your Homework with AI
Get the answers you need in no time with our AI-driven, step-by-step assistance
Get Started


