

Answered step by step
Verified Expert Solution
Question
1 Approved Answer
Same The table shows the number, expressed in millions, of citizens who moved in 2004, categorized by where they moved and whether they were
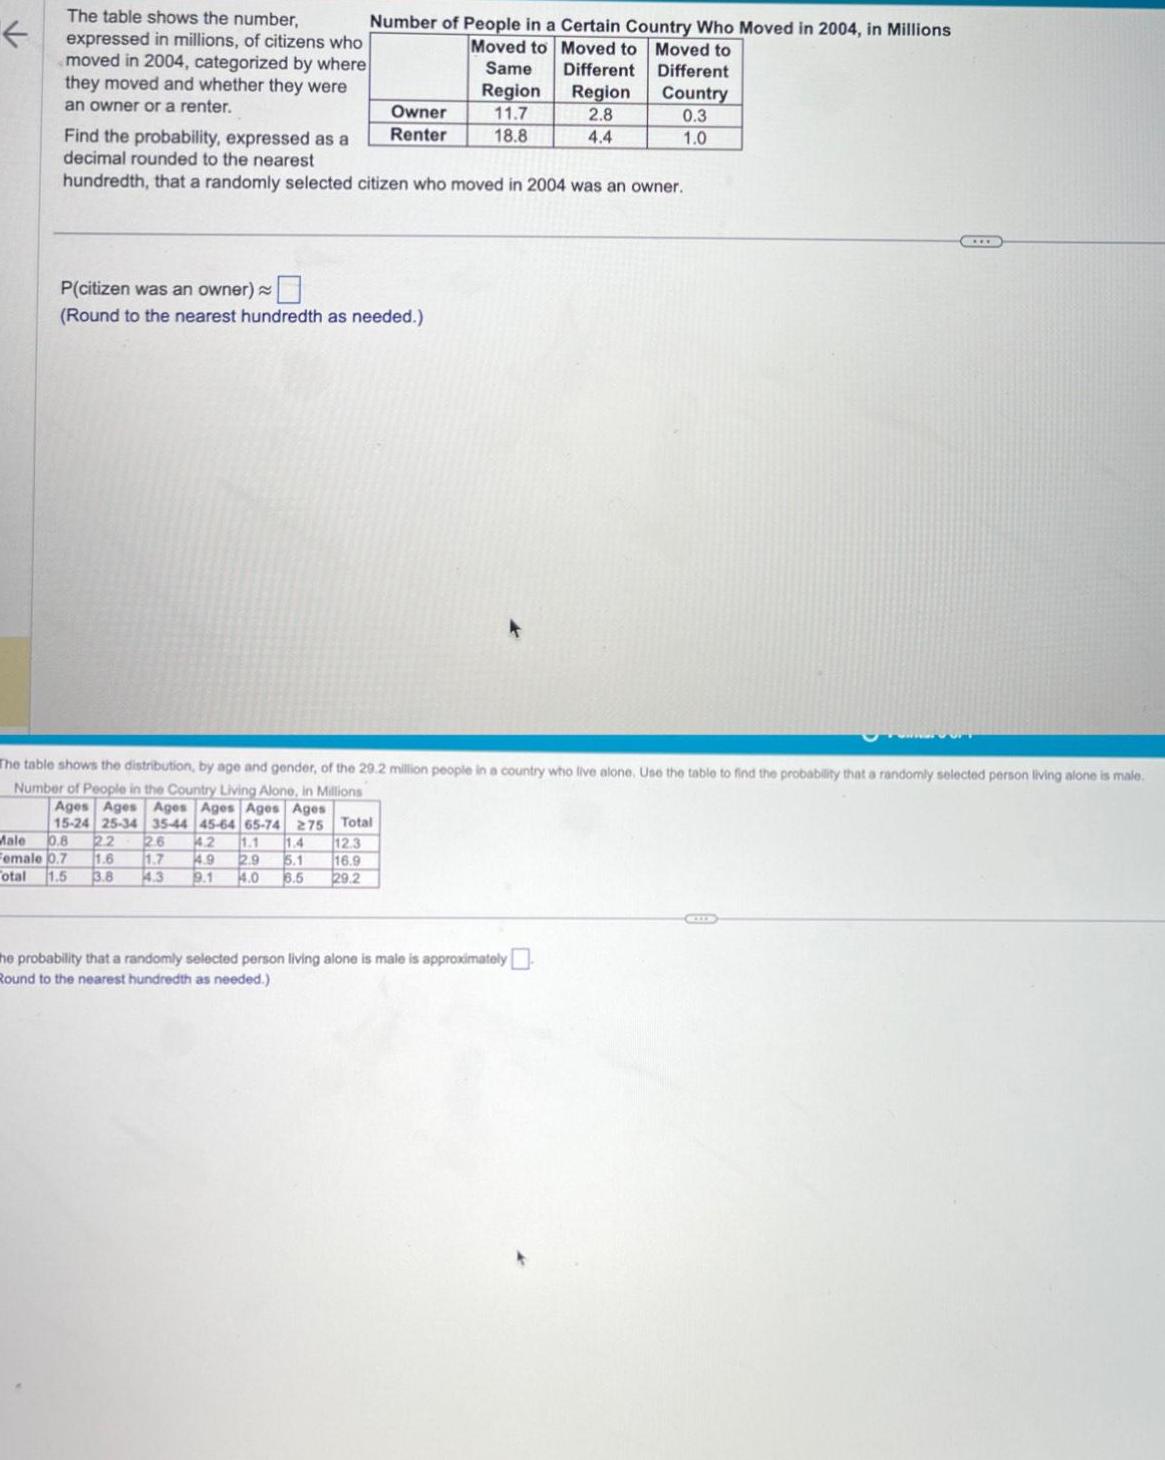
Same The table shows the number, expressed in millions, of citizens who moved in 2004, categorized by where they moved and whether they were Number of People in a Certain Country Who Moved in 2004, in Millions Moved to Moved to Moved to Different Different Region Region Country an owner or a renter. Owner 11.7 2.8 0.3 Find the probability, expressed as a Renter 18.8 4.4 1.0 decimal rounded to the nearest hundredth, that a randomly selected citizen who moved in 2004 was an owner. P(citizen was an owner) (Round to the nearest hundredth as needed.) The table shows the distribution, by age and gender, of the 29.2 million people in a country who live alone. Use the table to find the probability that a randomly selected person living alone is male. Number of People in the Country Living Alone, in Millions Ages Ages Ages Ages Ages Ages 15-24 25-34 35-44 45-64 65-74 275 Total 0.8 22 2.6 4.2 1.1 1.4 12.3 Female 0.7 1.6 1.7 4.9 2.9 5.1 16.9 Total 1.5 3.8 4.3 9.1 4.0 6.5 29.2 Male CLLD he probability that a randomly selected person living alone is male is approximately Round to the nearest hundredth as needed.)
Step by Step Solution
There are 3 Steps involved in it
Step: 1

Get Instant Access to Expert-Tailored Solutions
See step-by-step solutions with expert insights and AI powered tools for academic success
Step: 2

Step: 3
Ace Your Homework with AI
Get the answers you need in no time with our AI-driven, step-by-step assistance
Get Started
Exploring Geometry
Authors: Michael Hvidsten
2nd Edition
1498760821, 9781498760829