

Answered step by step
Verified Expert Solution
Question
1 Approved Answer
Sample output when testing Please don't copy other codes. I need a new answer as a separated code (code + console) def getSplittingPoints(data): (5 pts)
Sample output when testing
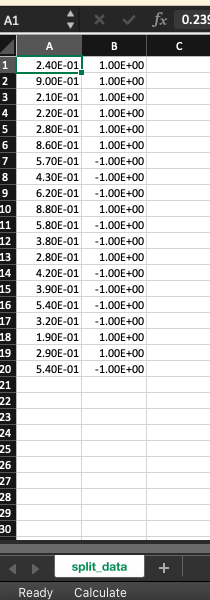
Please don't copy other codes. I need a new answer as a separated code (code + console)
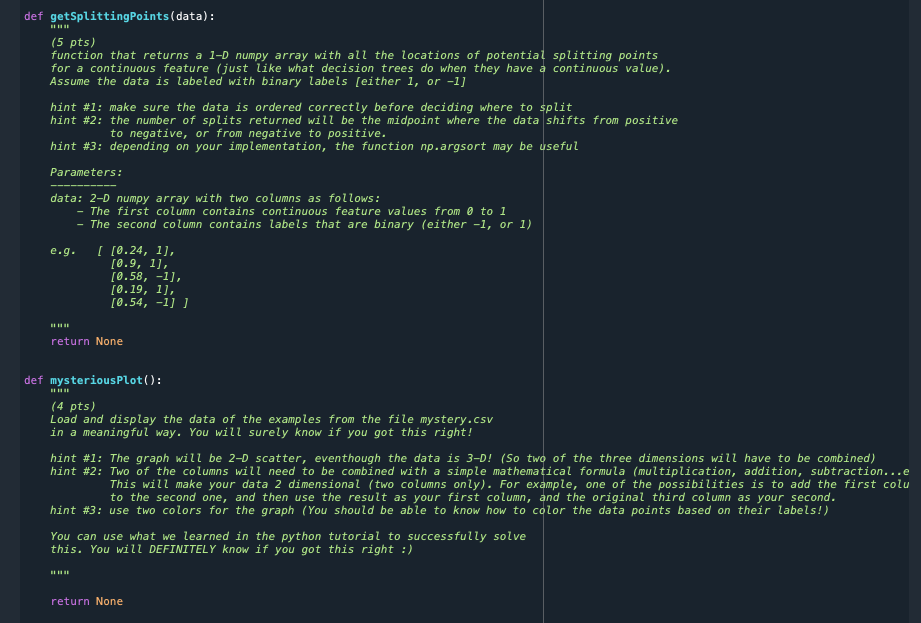
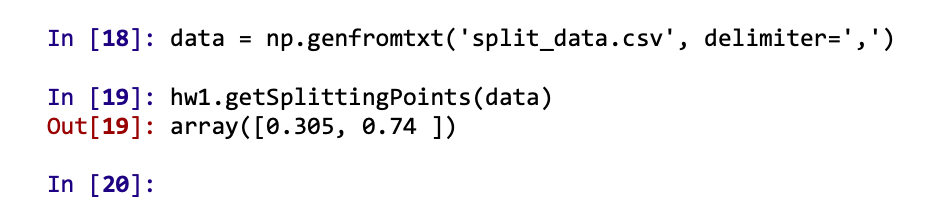
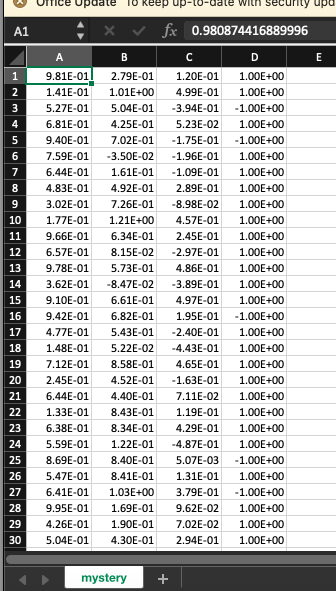
def getSplittingPoints(data): (5 pts) function that returns a 1-D numpy array with all the locations of potential splitting points for a continuous feature (just like what decision trees do when they have a continuous value). Assume the data is labeled with binary labels (either 1, or -1] hint #1: make sure the data is ordered correctly before deciding where to split hint #2: the number of splits returned will be the midpoint where the data shifts from positive to negative, or from negative to positive. hint #3: depending on your implementation, the function np.argsort may be useful Parameters: data: 2-D numpy array with two columns as follows: - The first column contains continuous feature values from 0 to 1 The second column contains labels that are binary (either -1, or 1) e.g. ( [0.24, 1), [0.9, 1], [0.58, -1), [0.19, 1], [0.54, -1] ] BI return None def mysteriousPlot(): (4 pts) Load and display the data of the examples from the file mystery.csv in a meaningful way. You will surely know if you got this right! hint #1: The graph will be 2-D scatter, eventhough the data is 3-D! (So two of the three dimensions will have to be combined) hint #2: Two of the columns will need to be combined with a simple mathematical formula (multiplication, addition, subtraction...e This will make your data 2 dimensional (two columns only). For example, one of the possibilities is to add the first colu to the second one, and then use the result as your first column, and the original third column as your second. hint #3: use two colors for the graph (You should be able to know how to color the data points based on their labels!) You can use what we learned in the python tutorial to successfully solve this. You will DEFINITELY know if you got this right :) return None mystery.csv sample_output.pdf split_data.csv In [18]: data np.genfromtxt('split_data.csv', delimiter=',') In [19]: hw1.getSplittingPoints(data) Out[19]: array( [0.305, 0.74 ]) In [20]: opdate Keep up-10- with security up A1 fx 0.980874416889996 A B C D E 1 2 3 4 5 6 7 8 9 10 11 12 13 14 15 16 17 18 19 20 21 22 23 9.81E-01 1.41E-01 5.27E-01 6.81E-01 9.40E-01 7.59E-01 6.44E-01 4.83E-01 3.02E-01 1.77E-01 9.66E-01 6.57E-01 9.78E-01 3.62E-01 9.10E-01 9.42E-01 4.77E-01 1.48E-01 7.12E-01 2.45E-01 6.44E-01 1.33E-01 6.38E-01 5.59E-01 8.69E-01 5.47E-01 6.41E-01 9.95E-01 4.26E-01 5.04E-01 2.79E-01 1.01E+00 5.04E-01 4.25E-01 7.02E-01 -3.50E-02 1.61E-01 4.92E-01 7.26E-01 1.21E+00 6.34E-01 8.15E-02 5.73E-01 -8.47E-02 6.61E-01 6.82E-01 5.43E-01 5.22E-02 8.58E-01 4.52E-01 4.40E-01 8.43E-01 8.34E-01 1.22E-01 8.40E-01 8.41E-01 1.03E+00 1.69E-01 1.90E-01 4.30E-01 1.20E-01 4.99E-01 -3.94E-01 5.23E-02 -1.75E-01 -1.96E-01 -1.09E-01 2.89E-01 -8.98E-02 4.57E-01 2.45E-01 -2.97E-01 4.86E-01 -3.89E-01 4.97E-01 1.95E-01 -2.40E-01 -4.43E-01 4.65E-01 -1.63E-01 7.11E-02 1.19E-01 4.29E-01 -4.87E-01 5.07E-03 1.31E-01 3.79E-01 9.62E-02 7.02E-02 2.94E-01 1.00E+00 1.00E+00 -1.00E+00 1.00E+00 -1.00E+00 1.00E+00 1.00E+00 1.00E+00 1.00E+00 1.00E+00 1.00E+00 1.00E+00 1.00E+00 1.00E+00 1.00E+00 -1.00E+00 1.00E+00 1.00E+00 1.00E+00 1.00E+00 1.00E+00 1.00E+00 1.00E+00 1.00E+00 -1.00E+00 1.00E+00 -1.00E+00 1.00E+00 1.00E+00 1.00E+00 24 25 26 27 28 29 30 mystery + A1 X fx 0.23 A B C 1 2 3 4 5 6 7 8 9 10 11 12 13 14 15 16 17 18 19 20 21 22 23 24 25 26 27 28 29 30 2.40E-01 9.00E-01 2.10E-01 2.20E-01 2.80E-01 8.60E-01 5.70E-01 4.30E-01 6.20E-01 8.80E-01 5.80E-01 3.80E-01 2.80E-01 4.20E-01 3.90E-01 5.40E-01 3.20E-01 1.90E-01 2.90E-01 5.40E-01 1.00E+00 1.00E+00 1.00E+00 1.00E+00 1.00E+00 1.00E+00 -1.00E+00 -1.00E+00 -1.00E+00 1.00E+00 -1.00E+00 -1.00E+00 1.00E+00 -1.00E+00 -1.00E+00 -1.00E+00 -1.00E+00 1.00E+00 1.00E+00 -1.00E+00 split_data + Ready Calculate def getSplittingPoints(data): (5 pts) function that returns a 1-D numpy array with all the locations of potential splitting points for a continuous feature (just like what decision trees do when they have a continuous value). Assume the data is labeled with binary labels (either 1, or -1] hint #1: make sure the data is ordered correctly before deciding where to split hint #2: the number of splits returned will be the midpoint where the data shifts from positive to negative, or from negative to positive. hint #3: depending on your implementation, the function np.argsort may be useful Parameters: data: 2-D numpy array with two columns as follows: - The first column contains continuous feature values from 0 to 1 The second column contains labels that are binary (either -1, or 1) e.g. ( [0.24, 1), [0.9, 1], [0.58, -1), [0.19, 1], [0.54, -1] ] BI return None def mysteriousPlot(): (4 pts) Load and display the data of the examples from the file mystery.csv in a meaningful way. You will surely know if you got this right! hint #1: The graph will be 2-D scatter, eventhough the data is 3-D! (So two of the three dimensions will have to be combined) hint #2: Two of the columns will need to be combined with a simple mathematical formula (multiplication, addition, subtraction...e This will make your data 2 dimensional (two columns only). For example, one of the possibilities is to add the first colu to the second one, and then use the result as your first column, and the original third column as your second. hint #3: use two colors for the graph (You should be able to know how to color the data points based on their labels!) You can use what we learned in the python tutorial to successfully solve this. You will DEFINITELY know if you got this right :) return None mystery.csv sample_output.pdf split_data.csv In [18]: data np.genfromtxt('split_data.csv', delimiter=',') In [19]: hw1.getSplittingPoints(data) Out[19]: array( [0.305, 0.74 ]) In [20]: opdate Keep up-10- with security up A1 fx 0.980874416889996 A B C D E 1 2 3 4 5 6 7 8 9 10 11 12 13 14 15 16 17 18 19 20 21 22 23 9.81E-01 1.41E-01 5.27E-01 6.81E-01 9.40E-01 7.59E-01 6.44E-01 4.83E-01 3.02E-01 1.77E-01 9.66E-01 6.57E-01 9.78E-01 3.62E-01 9.10E-01 9.42E-01 4.77E-01 1.48E-01 7.12E-01 2.45E-01 6.44E-01 1.33E-01 6.38E-01 5.59E-01 8.69E-01 5.47E-01 6.41E-01 9.95E-01 4.26E-01 5.04E-01 2.79E-01 1.01E+00 5.04E-01 4.25E-01 7.02E-01 -3.50E-02 1.61E-01 4.92E-01 7.26E-01 1.21E+00 6.34E-01 8.15E-02 5.73E-01 -8.47E-02 6.61E-01 6.82E-01 5.43E-01 5.22E-02 8.58E-01 4.52E-01 4.40E-01 8.43E-01 8.34E-01 1.22E-01 8.40E-01 8.41E-01 1.03E+00 1.69E-01 1.90E-01 4.30E-01 1.20E-01 4.99E-01 -3.94E-01 5.23E-02 -1.75E-01 -1.96E-01 -1.09E-01 2.89E-01 -8.98E-02 4.57E-01 2.45E-01 -2.97E-01 4.86E-01 -3.89E-01 4.97E-01 1.95E-01 -2.40E-01 -4.43E-01 4.65E-01 -1.63E-01 7.11E-02 1.19E-01 4.29E-01 -4.87E-01 5.07E-03 1.31E-01 3.79E-01 9.62E-02 7.02E-02 2.94E-01 1.00E+00 1.00E+00 -1.00E+00 1.00E+00 -1.00E+00 1.00E+00 1.00E+00 1.00E+00 1.00E+00 1.00E+00 1.00E+00 1.00E+00 1.00E+00 1.00E+00 1.00E+00 -1.00E+00 1.00E+00 1.00E+00 1.00E+00 1.00E+00 1.00E+00 1.00E+00 1.00E+00 1.00E+00 -1.00E+00 1.00E+00 -1.00E+00 1.00E+00 1.00E+00 1.00E+00 24 25 26 27 28 29 30 mystery + A1 X fx 0.23 A B C 1 2 3 4 5 6 7 8 9 10 11 12 13 14 15 16 17 18 19 20 21 22 23 24 25 26 27 28 29 30 2.40E-01 9.00E-01 2.10E-01 2.20E-01 2.80E-01 8.60E-01 5.70E-01 4.30E-01 6.20E-01 8.80E-01 5.80E-01 3.80E-01 2.80E-01 4.20E-01 3.90E-01 5.40E-01 3.20E-01 1.90E-01 2.90E-01 5.40E-01 1.00E+00 1.00E+00 1.00E+00 1.00E+00 1.00E+00 1.00E+00 -1.00E+00 -1.00E+00 -1.00E+00 1.00E+00 -1.00E+00 -1.00E+00 1.00E+00 -1.00E+00 -1.00E+00 -1.00E+00 -1.00E+00 1.00E+00 1.00E+00 -1.00E+00 split_data + Ready CalculateStep by Step Solution
There are 3 Steps involved in it
Step: 1

Get Instant Access to Expert-Tailored Solutions
See step-by-step solutions with expert insights and AI powered tools for academic success
Step: 2

Step: 3
Ace Your Homework with AI
Get the answers you need in no time with our AI-driven, step-by-step assistance
Get Started
Semantics Of A Networked World Semantics For Grid Databases First International Ifip Conference Icsnw 2004 Paris France June 2004 Revised Selected Papers Lncs 3226
Authors: Mokrane Bouzeghoub ,Carole Goble ,Vipul Kashyap ,Stefano Spaccapietra
2004 Edition
3540236090, 978-3540236092