

Answered step by step
Verified Expert Solution
Question
1 Approved Answer
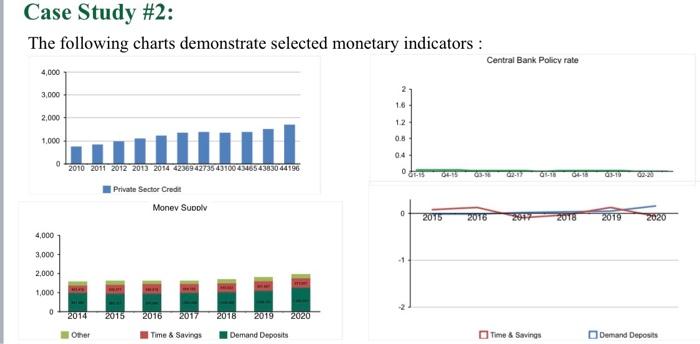
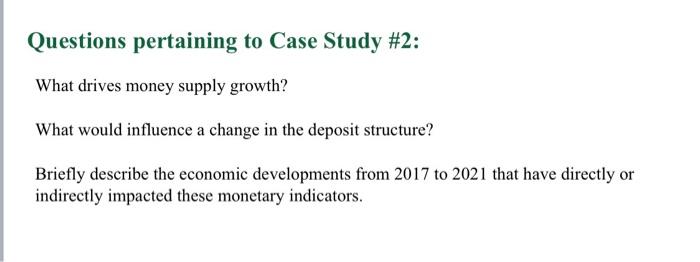
(Saudi Arabia) Case Study #2: The following charts demonstrate selected monetary indicators : Central Bank Policy rate 4,000 3,000 16 2,000 12 1.000 08 04
(Saudi Arabia)
Case Study #2: The following charts demonstrate selected monetary indicators : Central Bank Policy rate 4,000 3,000 16 2,000 12 1.000 08 04 0 OF- GA 2010 2011 2012 2013 2014 423694275 431004485 4430 44196 Private Sector Credit Monev Supolv 0 2015 2016 2016 2019 2020 4,000 3.000 2,000 1,000 0 2014 2015 2016 2017 2018 2019 2020 Omer Time & Savings Demand Deposits Time & Savings Demand Deposits Questions pertaining to Case Study #2: What drives money supply growth? What would influence a change in the deposit structure? Briefly describe the economic developments from 2017 to 2021 that have directly or indirectly impacted these monetary indicators Step by Step Solution
There are 3 Steps involved in it
Step: 1

Get Instant Access to Expert-Tailored Solutions
See step-by-step solutions with expert insights and AI powered tools for academic success
Step: 2

Step: 3
Ace Your Homework with AI
Get the answers you need in no time with our AI-driven, step-by-step assistance
Get Started
A Textbook Of Cost And Management Accounting
Authors: Arora
10th Edition
9789325956209