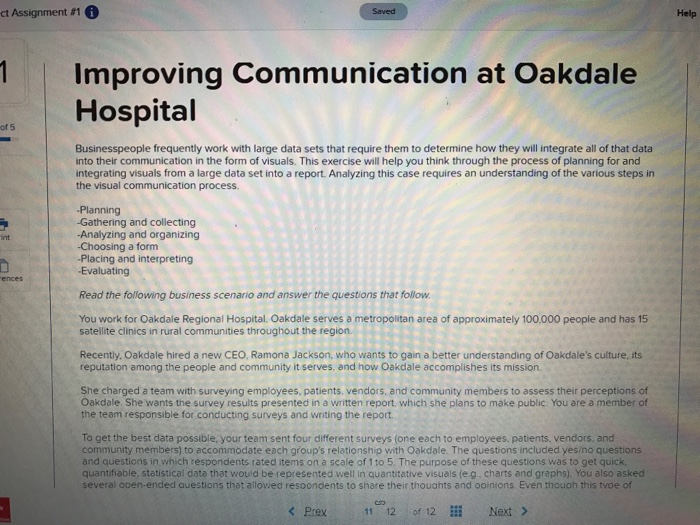
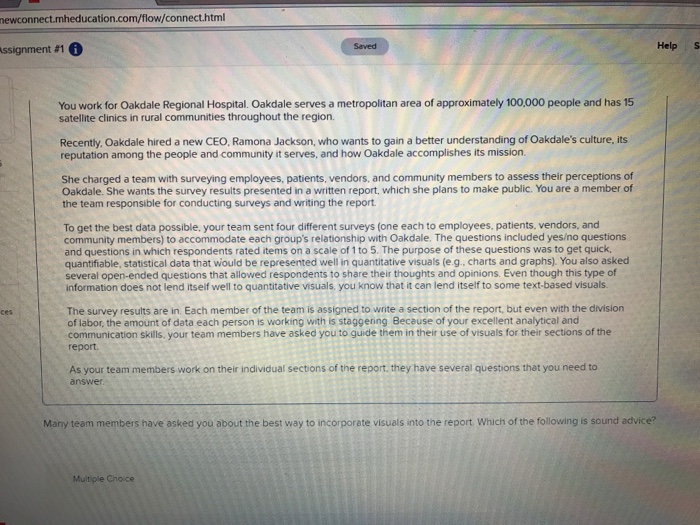
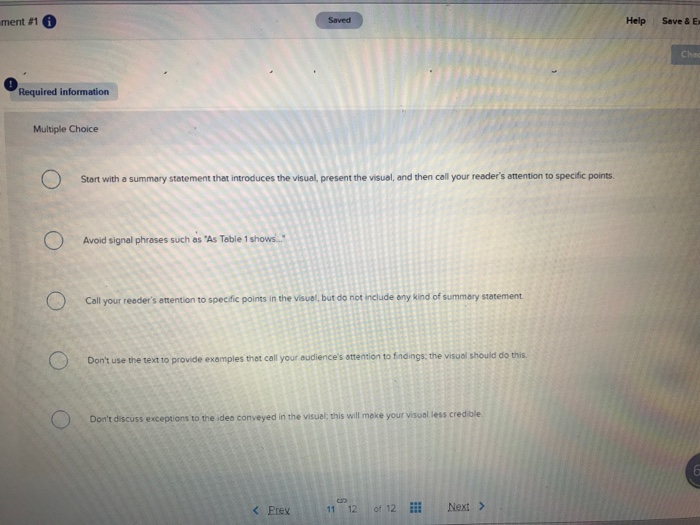
Question: Saved ct Assignment #1 Help 1Improving Communication at Oakdale Hospital of 5 Businesspeople frequently work with large data sets that require them to determine how


Saved ct Assignment #1 Help 1Improving Communication at Oakdale Hospital of 5 Businesspeople frequently work with large data sets that require them to determine how they will integrate all of that data into their communication in the form of visuals. This exercise will help you think through the process of planning for and integrating visuals from a large data set into a report. Analyzing this case requires an understanding of the various steps in the visual communication process. Planning -Gathering and collecting -Analyzing and organizing -Choosing a form -Placing and interpreting Evaluating Read the following business scenario and answer the questions that follow You work for Oakdale Regional Hospital. Oakdale serves a metropolitan area of approximately 100.000 people and has 15 satellite clinics in rural communities throughout the region. Recently, Oakdale hired a new CEO, Ramona Jackson, who wants to gain a better understanding of Oakdale's culture, its reputation among the people and community it serves, and how Oakdale accomplishes its mission She charged a team with surveying employees, patients, vendors. and community members to assess their perceptions of Oakdale. She wants the survey results presented in a written report. which she plans to make public. You are a member of the team responsible for conducting surveys and writing the report To get the best data possible, your team sent four different surveys (one each to employees, patients, vendors. and community members) to accommodate each group's relationship with Oakdale. The questions included yeso questions and questions in which respondents rated items on a scale of 1 to 5. The purpose of these questions was to get quick quantifiable, statistical data that would be represented well In quantitative visuals (e.g. charts and graphs). You also asked several open-ended auestions that allowed resoondents to share their thouahts and opinions. Even thouah this tvoe of K Prex 1112; of 12 Next >
Step by Step Solution
There are 3 Steps involved in it

Get step-by-step solutions from verified subject matter experts


