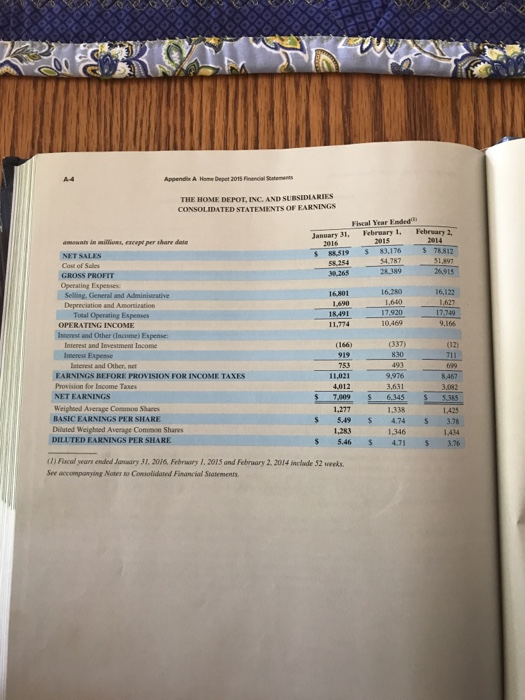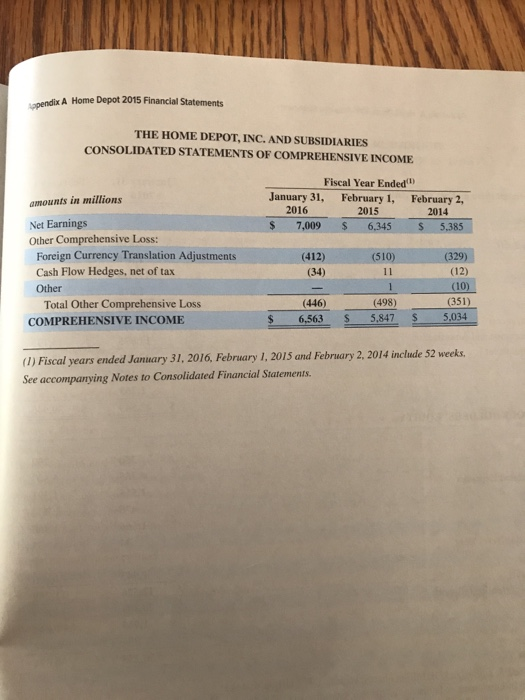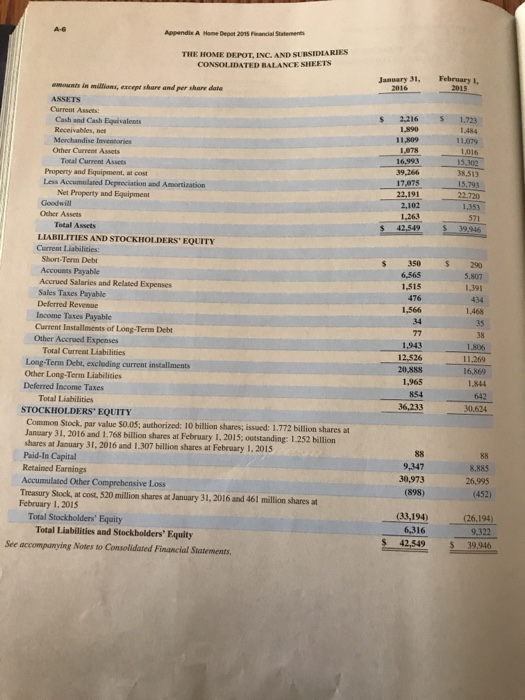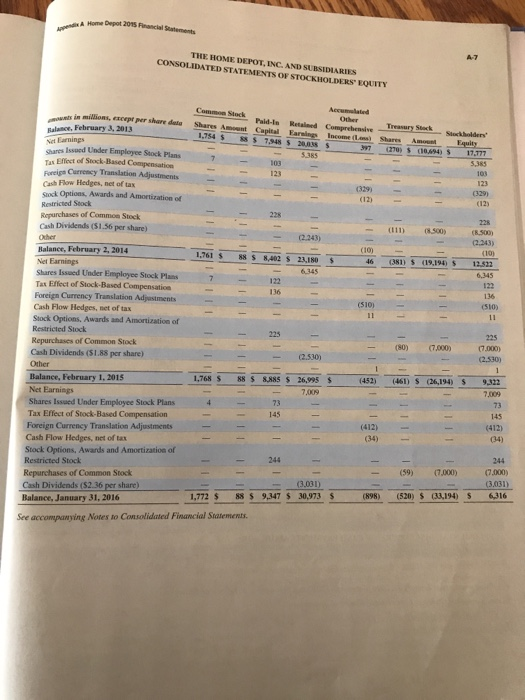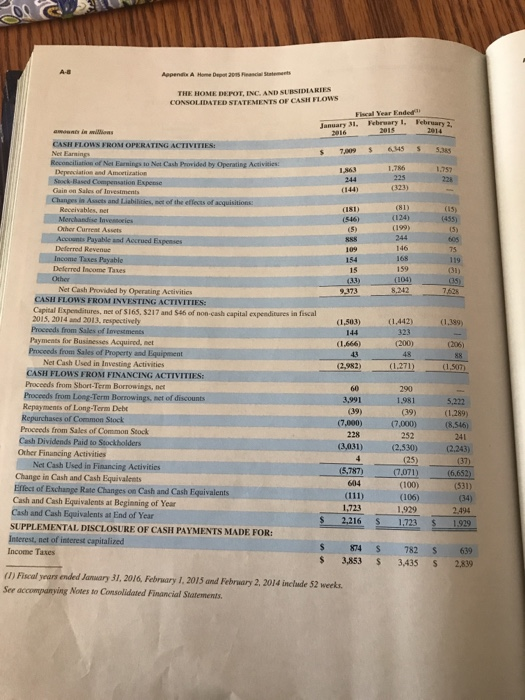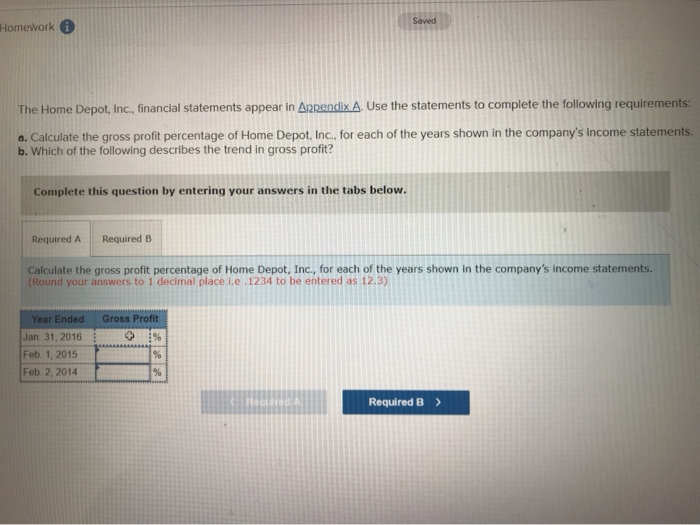
Saved Homework i The Home Depot, Inc., financial statements appear in Appendix A. Use the statements to complete the following requirements: a. Calculate the gross profit percentage of Home Depot, Inc. for each of the years shown in the company's income statements. b. Which of the following describes the trend in gross profit? Complete this question by entering your answers in the tabs below Required A Required B Calculate the gross profit percentage of Home Depot, Inc., for each of the years shown in the company's income statements. (Round your answers to 1 decimal place i.e.1234 to be entered as 12.3) Gross Profit Year Ended Jan 31, 2016 Feb 1, 2015 Feb 2, 2014 Required B A4 Appendix A Home Depet 2015 Fnancial Statements THE HOME DEPOT, INC. AND SURSIDIARIES CONSOLIDATED STATEMENTS OF EARNINGS Fiscal Year Ended February 1, 2015 February 2, 2014 January 31, 2016 amouats in millions, except per share date $ 78812 83.176 88.519 S NET SALES 54.787 51,897 58.254 Cost of Sales 26915 28.389 30.265 GROSS PROFIT Operating Expenses Selling, General and Administrative Depreciation and Amortization 16,280 16,122 16.501 1,640 1,627 L690 17.749 17.920 18.491 Total Operating Expenses OPERATING INCOME Innerest and Other (Income) Expense 10.469 9,166 11.774 (337) (12) Interest and Investment Income (166) 830 Inmerest Expense 919 711 753 493 leterest and Other, net 699 EARNINGS BEFORE PROVISION FOR INCOME TAXES 11,021 9976 8,467 Provision for Income Taxes 4.012 3,631 3,082 NET EARNINGS 7,009 6345 S 5.385 Weighted Average Common Shares. 1.277 1.338 1,425 BASIC EARNINGS PER SHARE 549 4.74 3.78 Dilated Weighted Average Common Shares 1,283 1,346 1.,434 DILUTED EARNINGS PER SHARE 5.46 4.71 3.76 (d) Fiscal vears ended January 31, 2016, February 1, 2015 and February 2, 2014 inclade 52 weeks. See accompanying Notes to Coiolidated Financial Statements. pendix A Home Depot 2015 Financial Statements THE HOME DEPOT, INC. AND SUBSIDIARIES CONSOLIDATED STATEMENTS OF COMPREHENSIVE INCOME Fiscal Year Ended January 31, February 1, February 2, amounts in millions 2016 2015 2014 Net Earnings Other Comprehensive Loss: Foreign Currency Translation Adjustments Cash Flow Hedges, net of tax S 7,009 6,345 S 5,385 (412) (510) (329) (12) (34) 11 (10) 1 Other (351) Total Other Comprehensive Loss (498) (446) 5,847 5,034 $ 6.563 COMPREHENSIVE INCOME (1) Fiscal years ended January 31, 2016, February 1, 2015 and February 2, 2014 include 52 weeks See accompanying Notes to Consolidated Financial Statements. A-G Appendis A Home Depot 2015 Fnancial Statements THE HOME DEPOT. INC. AND SUBSIDIARIES CONSOLIDATED BALANCE SHEETS February 1, January 31, 2016 2015 amounts in millions, exceet share and per share dato ASSETS Current Assets 1,723 2,216 Cash and Cash Equivalents Receivables, ner Merchandise Inventories Other Current Assetsa 1,484. 1,890 11.809 11,079 1,078 1,016 16.993 15.302 Tocal Current Assets 39,266 38.513 Property and Equipment, at cost Less Accumulaned Deprociation and Amortization Net Property and Equipment. 17.075 15,793 22.720 22.191 2,102 1,353 Goodwill 1,263 571 Other Assets 39.946 42.549 Total Assets LIABILITIES AND STOCKHOLDERS EQUITY Current Liabilities 350 290 Short-Term Debt 6,565 5,807 Accounts Payable Accrued Salaries and Relatedd Expenses Sales Taxes Payable Deferred Revenue 1,515 1,391 434 476 1.566 1,468 Income Taxes Payable Current Installments of Long-Term Debt. Other Accrued Expenses Total Current Liabilities Long-Term Debt, excloding current installments Other Long-Term Liabilities 34 34 38 77 1,943 1,806 12.526 11.269 20.888 16,869 1,965 1,844 Deferred Income Taxes Total Liabilities 854 642 36,233 30,624 STOCKHOLDERS' EQUITY Common Stock, par value $0.05; authorized: 10 billion shares; issued: 1.772 billion shares at January 31, 2016 and 1.768 billion shares at February 1, 2015; outstanding: 1.252 billion shares at January 31, 2016 and 1.307 billion shares at February 1, 2015 Paid-In Capital 88 88 8,885 9,347 Retained Earnings Accumulated Other Comprehensive Loss Treasury Stock, at cost, 520 million shares at January 31, 2016 and 461 million shares at February 1, 2015 Total Stockholders' Equity Total Liabilities and Stockholders' Equity 30,973 26,995 (898) (452) (33,194) (26.194) 6,316 9.322 42,549 39,946 See accompanying Notes to Consolidated Financial Statements pendA Home Depot 2015 Financial Statements A7 THE HOME DEPOT, INC. AND SUBSIDLARIES CONSOLIDATED STATEMENTS OF STOCKHOLDERS EQUITY Accumlated Othen Retalned Comprehensive Income (Lm Common Steck in millions, except per share deta Paid-In Capital Treasury Stock Shares Amost Stockholdery Ralance, February 3, 2013 Earsings 88 S 7948S 20a38 s Shares 1.354 S Amount Equity Net Earnings shares Issued Under Employee Stock Plans Ts Effect of Stock-Based Compensation prrign Currency Translation Adjustments Cash Flow Hedges, net of tax sack Options, Awards and Amortization of Restricted Stock Repurchases of Common Stock Cash Dividends ($1.56 per share) 397 (270) (30,94) S 17,777 5385 5,385 103 103 123 123 (329) (329) (12 (12) 228 228 (111) (8.500) (8.500) (2243) (2.243) Other (10) (10) Balance, February 2, 2014 Net Earnings Shares Issued Under Employee Stock Plans Tas Effect of Stock-Based Compensation Foreign Currency Translation Adjustments Cash Flow Hedges, net of tax Stock Options, Awards and Amortization of 1.761 88 S 8.402S 23.180 (381) $ (19.194) 12.522 6.345 6.345 122 122 136 136 (510) (510) 11 11 225 Restricted Stock 225 Repurchases of Common Stock Cash Dividends ($1.88 per share) (7.000) (80) (7,000) (2,530) (2.530) Other (461) S (26,194) 9.322 8885 $ 26,995 $. (452) Balance, February 1, 2015 Net Earnings Shares Issued Under Employee Stock Plans Tax Effect of Stock-Based Compensation Foreign Currency Translation Adjustments 88 S 1,768 S 7,009 7,009 73 73 145 145 (412) (412) 04) (34) Cash F Hedges, net of tax Stock Options, Awards and Amortization of Restricted Stock 244 244 (7.000) (59) (7,000) Repurchases of Common Stock (3,031) (3,031) Cash Dividends ($2.36 per share) 6316 (520) $ (33L194) S 9,347 30,973 $ (898). 88 S 1,772 $ Balance, January 31, 2016 See accompanying Notes to Consolidated Financial Statements. A-B Appendis A Home Depot 2015 Fnancial Statements THE HOME DEPOT, INC. AND SUBSIDIARIES CONSOLIDTED STATEMENTS OF CASH FLOWS Flscal Year Ended February 1, February 2, 2014 January 31- 2016 2015 amounty in amilliens CASH FLOWS FROM OPERATING ACTIVITIES Net Earmings Reconciliation of Net Earnings to Net Cash Provided by Operating Activities: Depeeciation and Amortization Stock-Based Compensation Expesse Gain on Sales of Investments 5385 6.345 7009 1.786 1368 1.757 225 228 244 (323) (144) Changes in Asscts and Liabilities, net of the effects of acquisitionns Receivables, net (81) (15) (181) (124) Merchandise Invessories Other Current Assets (455) (3) (546) (199) (5k Accounts Payable and Accrued Expenses 244 888 605 146 Deferred Revenues 75 109 Income Taxes Payable Deferred Income Taxes 168 154. 119 159 15 Other (104) a5) 7,628 (33) Net Cash Provided by Operating Activities CASH FLOWS FROM INVESTING ACTIVITIES: 8.242 9.373 Capital Expenditures, net of S165, $217 and S46 of non-cash capital expenditures in fiscal 2015, 2014 and 2013, respectively (1,442) (1,503) (1,389) Proceeds from Sales of Investments 323 144 Payments for Businesses Acquired, net Proceeds from Sales of Property and Equipment (200) (1666) (206) 48 41 88 Net Cash Used in Investing Activities (2,982) (1,271) (1,507) CASH FLOWS FROM FINANCING ACTIVITIES: Proceeds from Short-Term Borrowings, net Proceeds from Long-Term Borrowings, net of discounts Repayments of Long-Term Debt Repurchases of Common Stock Proceeds from Sales of Common Stock 60 290 3,991 1,981 5.222 (39) (39) (1,289) (8,546) (7,000) (7,000) 228 252 241 Cash Dividends Paid to Stockholders (3,031) (2,530) (2.243) Other Financing Activities (25) 4. (37) Net Cash Used in Financing Activities Change in Cash and Cash Equivalents Effect of Exchange Rate Changes on Cash and Cash Equivalents Cash and Cash Equivalents at Begianing of Year (5,787) (7,071) (6,652) 604 (100) (531) (111) 1,723 (106) (34) 1,929 2494 Cash and Cash Equivalents at End of Year 2.216 1,723 1.929 SUPPLEMENTAL DISCLOSURE OF CASH PAYMENTS MADE FOR: Interest, net of interest capitalized 874 782 Income Taxes S 639 3,853 3,435 S 2839 () Fiscal years ended January 31, 2016, February 1, 2015 and February 2, 2014 include 52 weeks See accompanying Notes to Cosolidated Financial Statements