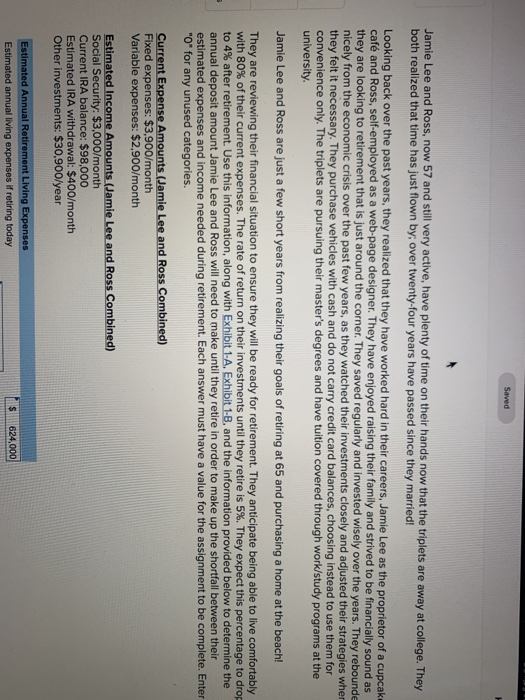
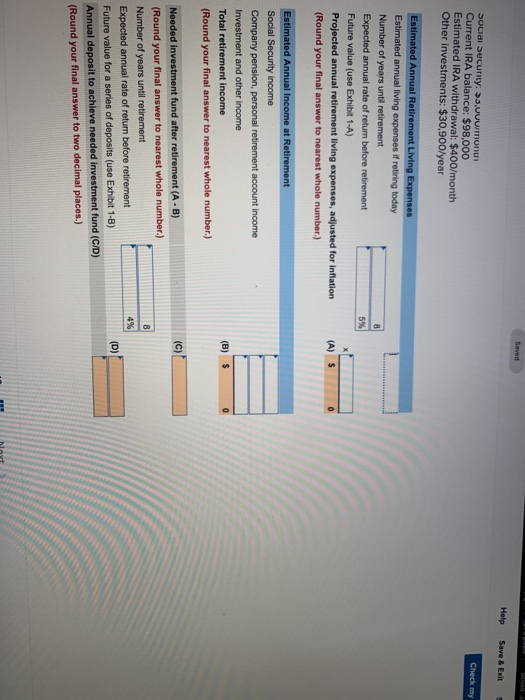
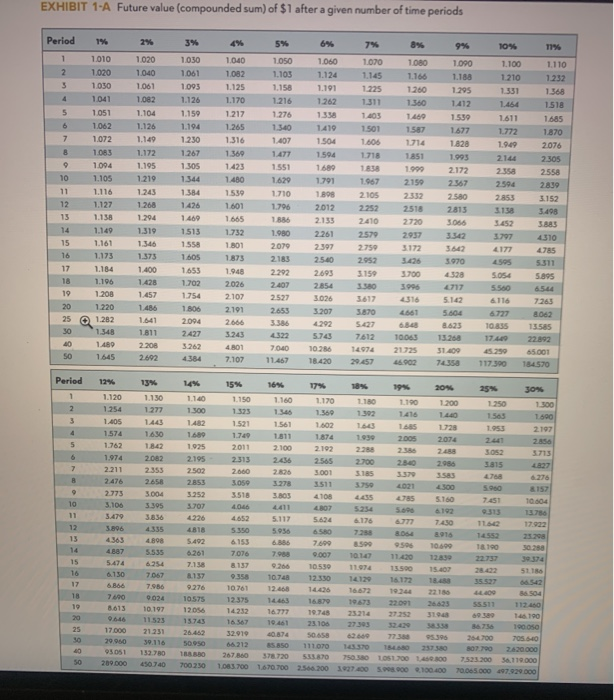
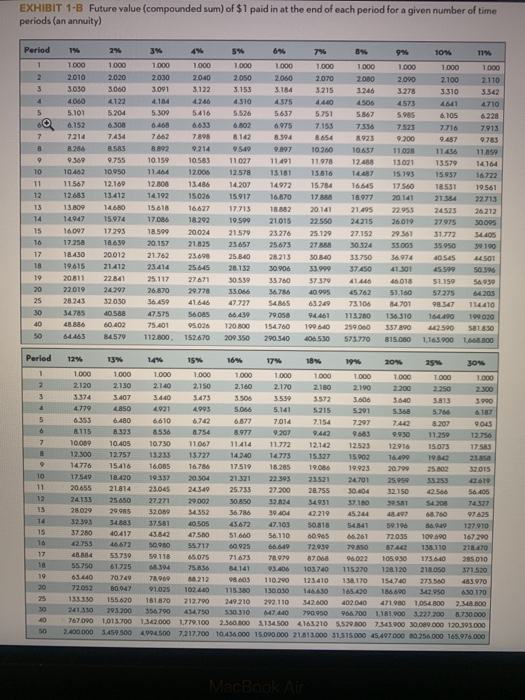
Saved Jamie Lee and Ross, now 57 and still very active, have plenty of time on their hands now that the triplets are away at college. They both realized that time has just flown by, over twenty-four years have passed since they married! Looking back over the past years, they realized that they have worked hard in their careers, Jamie Lee as the proprietor of a cupcak caf and Ross, self-employed as a web page designer. They have enjoyed raising their family and strived to be financially sound as they are looking to retirement that is just around the corner. They saved regularly and invested wisely over the years. They rebounde nicely from the economic crisis over the past few years, as they watched their investments closely and adjusted their strategies wher they felt it necessary. They purchase vehicles with cash and do not carry credit card balances, choosing instead to use them for convenience only. The triplets are pursuing their master's degrees and have tuition covered through work/study programs at the university Jamie Lee and Ross are just a few short years from realizing their goals of retiring at 65 and purchasing a home at the beach! They are reviewing their financial situation to ensure they will be ready for retirement. They anticipate being able to live comfortably with 80% of their current expenses. The rate of return on their investments until they retire is 5%. They expect this percentage to drop to 4% after retirement. Use this information, along with Exhibit 1-A. Exhibit 1-B, and the information provided below to determine the annual deposit amount Jamie Lee and Ross will need to make until they retire in order to make up the shortfall between their estimated expenses and income needed during retirement. Each answer must have a value for the assignment to be complete. Enter "O" for any unused categories. Current Expense Amounts (Jamie Lee and Ross Combined) Fixed expenses: $3,900/month Variable expenses: $2,900/month Estimated Income Amounts (Jamie Lee and Ross Combined) Social Security: $3,000/month Current IRA balance: $98,000 Estimated IRA withdrawal: $400/month Other investments: $30,900/year Estimated Annual Retirement Living Expenses Estimated annual living expenses if retiring today MS 624,000 Saved Help Save & Exit Check my Social Security: >3, Vuurmonun Current IRA balance: $98,000 Estimated IRA withdrawal: $400/month Other investments: $30.900/year Estimated Annual Retirement Living Expenses Estimated annual living expenses if retiring today Number of years until retirement Expected annual rate of return before retirement Future value (use Exhibit 1-A) Projected annual retirement living expenses, adjusted for inflation (Round your final answer to nearest whole number.) (A) Estimated Annual Income at Retirement Social Security income Company pension, personal retirement account income Investment and other income Total retirement income (Round your final answer to nearest whole number.) (c) Needed investment fund after retirement (A-B) (Round your final answer to nearest whole number.) Number of years until retirement Expected annual rate of return before retirement Future value for a series of deposits (use Exhibit 1-B) Annual deposit to achieve needed investment fund (C/D) (Round your final answer to two decimal places.) EXHIBIT 1-A Future value (compounded sum) of $1 after a given number of time periods 10% 1.100 17% 1.110 1.210 12:32 1331 1 154 1.368 1518 1718 1620 Period 1% 1 2010 2 1.020 1030 1041 1051 1.062 1,072 1083 1004 1.105 1,116 1.127 13 1.130 1149 1.161 1.173 17 1184 18 1.196 19 1.208 20 1.220 25 1.282 301.348 10 1.480 50 1645 2% 3% 4% 5% 1020 1030 1000 1050 1.040 1061 10821.103 1061 1095 1.125 10821.126 1.170 1.216 2104 1.150 1217 1.276 1.126 1.194 1.265 1.340 1.149 1230 1316 1.407 1.1721267 1.369 1.477 105 1305 1.551 12191 1.490 1 243 1114 1539 1710 128 1476 1601 1. 200 1400 1665 10 1319 15732180 1513 14 15 1801 2019 1375 1605 2165 1400 1653 1.948 2292 1428 1.702 2 026 2407 1.457 1.754 2.107 3527 14 TAS 2101 2653 1.641 2 004 1811 2.427 3.243 .322 2.208 322 4.01 7040 2.402 4.384 7.107 11.45) 6% 7% 8% 9% 1.000 1.000 1.000 1.000 1.124 1145 1166 1.183 1.191 1.260 1.295 1362 1311 1412 139 1.003 1.40 1.539 1410 1501 1504 1606 1714 1820 1.594 1851 1003 1000 1050 1000 2172 1701 1067 2150 247 1808 2105 2012 2252 2518 2815 2135 240 2720 3000 2579 2017 2007 2750 31 5602 25.00 5970 2693 5159 2854 3580 3026 3617 316 5102 3.207 5604 25.07 . 8425 5.73 76121006 15268 10 26 14974 2 1735 51.000 18.420 22.457 48902 72358 1.611 1772 19.49 214 2358 2504 2 153 148 3452 1797 4177 1685 1870 2076 2305 2558 2839 152 3498 3003 4310 5 1511 5.054 5.1895 6116 743 67270 105 TS 17.40 5.250 1 17.390 22892 65.001 184570 Period 14 15 16 17% 30 30% 1 2 1170 1.300 162 1180 1302 163 1 190 1410 200 1400 7 28 250 150s LOSS 300 1000 2197 3 2.192 3511 4108 3157 10 5160 564 17 1 .120 1130 1140 1150 1160 1.254 1.2771300 1323 130 1.405 1443 14821521 1.561 1.574 1630 1680 1762 142 1925 2011 2100 1.974 2082 2105 2.211 2353 2502 2.660 2006 2.476 3059 3004 3.106 3.305 3707 40 4411 30 3.06 4363 BOB 5492 61538 4887 7.076 5.474 266 6.130 7057 21 107 6.856 7986 276 10761 1 1024 10575 12.375 1 8.613 10.197 120 1423216777 900 11523 13743 laser 10001 17.000 21231 20402 32.910 60 874 20 960 39.116 50950 66.212 SO 93051 152.730 370 3720 209.000 4500000 1000 1000 7600 0.007 10530 12 50 01 110 B03915 50 10.699 18190 1140 12830 22737 0 15.02 .02 5118 2 22 27 32000 77 3 10.74 2521 23.100 27303 50 1110 TO 100 10 25 30 13 38504 23 3 198 99 190 sasso 750 190.000 396 34700 705 50 150 250 000 0 751300 119000 100 000 9799 000 15 0 EXHIBIT 1-B Future value (compounded sum) of $1 paid in at the end of each period for a given number of time periods (an annuity) Period 2 4122 5.101 7 8 2% 3% 4% 5% 6% 1.000 1.000 1.000 1.000 1.000 1.000 1.000 1.000 1.000 2010 2020 2030 2000 2000 2000 2010 2000 2000 3030 3000 3091 3122 3.153 3 154 3215 326 3278 4 DSO 246 5 5.204 5300 5416 5.526 5637 5.751 5867 5 985 6152 6 308 6.468 6633 6 802 6.975 7.153 7336 7523 721474547278988142 394 8.654 8.925 9200 RSS 802 9214 999 99 100 10437 1108 w 7 55 1019 103 11027 1141 11 978128 13021 10 10 950 11.454 1200512578 13181 13.816 47 15193 11.567 12.169 12.08 13.406 14.207 14972 15.754 16645 17560 12 3 13.412 14192 15026 15 917 16.570 17 1 8 977 20141 13809 1 4680 1 5618 16.627 17.713 18.882 20.141 21.495 22.953 14947 15.974 17086 18.292 10.500 21015 22.550 24215 26.019 160971793 18.59920024 21.579 23276 25.129 27.152 29.361 17.258 18.639 20.157 21825 2365725673 27 50 324 53005 20012 2 1762 23.698 25840 28213 30 30 33.750 $6974 19015 21412 23414 25.045 28.132 30 906 3 37.50 41 501 20811 2241 25.117 27671 30 539 3576073 4 1 018 24.297 26870 20778 3 3056 36786 0905 45 762 51.140 28 243 32050 36.50 54.365 33 73106 01 45 10.558 SAS 66.439 2008 04451 11370 136 310 60402 75.401 95.026 120 300 154.760 190 6.40 259.000 337890 64.463 4579 112.800. 152670 209 350 290 340 606 530 573.770 815.080 10% 1.000 1.000 2100 2110 3310 3342 4710 6 105 6228 7716 7913 9.487 783 114 11 859 13579 14164 15937 16722 1855119.561 21 4 22 713 24525 26212 27.975 30.005 31.772 4.405 3 5950 39.190 10 545 501 55 5039 S1150 54999 10 11 13 14 15 18.430 22019 08 114419 10000 164.490 2.500 1.16.3.200 1.668.800 Period 14776 15.416 ESPERSES **** 12% 13% 14% 15% 16% 17% 18% 19% 20% 25% 30% 1000 1000 1000 1000 1.000 1.000 1000 1000 1000 1000 1000 2120 2130 2140 2150 2 160 2170 2100 2.190 2200 2350 2300 3374 1.407 403.473350635393572 5606 S 1 3 990 USO 021 403 5.066 5.141 5215 5.915 7 19 6.40 6.610 676 6.877 7014 7.154 7297 742 2 07 11581333 8536 754 977 9207 42 6 3 99301120 12756 1000 10.405 10.730 11067 11414 11.772 12.142 12.523 12916 15.073 17583 12.300 12.757 13233 1 3727 14.240 1 4773 15327 15.902 16.499 19 342 23.858 16.085 1676 17.519 18205 1906 19023 20.700 25 12 32015 12.540 18.420 19337 20304 21.321 22 393 23521 2 4701 25.950 333 20655 21.814 23.045 24349 30.04 32.150 506 56.405 25.650 27271 20002 50 850 32 34 349317180 4 30 28.029 29.985 320 4352 676 30.00 2219 97625 32.303 43 781 67 103 184341 01 127910 37280 4 | 0 0 0 0 0 167290 42.753 46.672 90 55717 60 925 66 64 729397 30 8740 138.110 218.70 48.54 55 730 50.118 5.0 TS 71.675 78970 87058 05.022 105.930 173.60 285010 55.750 61.725 66394 75.836 4141 93.406 10740 115.270 128.120218050 371.520 63.440 70.749 78.969 8212 9 8.603 110200123410 138 170 15,70 273.560 483.970 72.052 0.947 01025 103.40 115 1 3000 1440 165.620 186.600 342.950 6.30-170 133.330 155.620 181.870 212.700 249 210 292.110 4200 400040 471 900 1014 NO 2548 800 241330 295.200 3547904470530310 40 50 700 1.181.9003727.2008 730 000 767000013700 134.000 100 2360001545004161105 300 7343.00 30.000000 120.393.000 2.400 000 1450 500 4045007217100 10000 15000 11000 115000 45.497000 8054000 165.976 000 50 Saved Jamie Lee and Ross, now 57 and still very active, have plenty of time on their hands now that the triplets are away at college. They both realized that time has just flown by, over twenty-four years have passed since they married! Looking back over the past years, they realized that they have worked hard in their careers, Jamie Lee as the proprietor of a cupcak caf and Ross, self-employed as a web page designer. They have enjoyed raising their family and strived to be financially sound as they are looking to retirement that is just around the corner. They saved regularly and invested wisely over the years. They rebounde nicely from the economic crisis over the past few years, as they watched their investments closely and adjusted their strategies wher they felt it necessary. They purchase vehicles with cash and do not carry credit card balances, choosing instead to use them for convenience only. The triplets are pursuing their master's degrees and have tuition covered through work/study programs at the university Jamie Lee and Ross are just a few short years from realizing their goals of retiring at 65 and purchasing a home at the beach! They are reviewing their financial situation to ensure they will be ready for retirement. They anticipate being able to live comfortably with 80% of their current expenses. The rate of return on their investments until they retire is 5%. They expect this percentage to drop to 4% after retirement. Use this information, along with Exhibit 1-A. Exhibit 1-B, and the information provided below to determine the annual deposit amount Jamie Lee and Ross will need to make until they retire in order to make up the shortfall between their estimated expenses and income needed during retirement. Each answer must have a value for the assignment to be complete. Enter "O" for any unused categories. Current Expense Amounts (Jamie Lee and Ross Combined) Fixed expenses: $3,900/month Variable expenses: $2,900/month Estimated Income Amounts (Jamie Lee and Ross Combined) Social Security: $3,000/month Current IRA balance: $98,000 Estimated IRA withdrawal: $400/month Other investments: $30,900/year Estimated Annual Retirement Living Expenses Estimated annual living expenses if retiring today MS 624,000 Saved Help Save & Exit Check my Social Security: >3, Vuurmonun Current IRA balance: $98,000 Estimated IRA withdrawal: $400/month Other investments: $30.900/year Estimated Annual Retirement Living Expenses Estimated annual living expenses if retiring today Number of years until retirement Expected annual rate of return before retirement Future value (use Exhibit 1-A) Projected annual retirement living expenses, adjusted for inflation (Round your final answer to nearest whole number.) (A) Estimated Annual Income at Retirement Social Security income Company pension, personal retirement account income Investment and other income Total retirement income (Round your final answer to nearest whole number.) (c) Needed investment fund after retirement (A-B) (Round your final answer to nearest whole number.) Number of years until retirement Expected annual rate of return before retirement Future value for a series of deposits (use Exhibit 1-B) Annual deposit to achieve needed investment fund (C/D) (Round your final answer to two decimal places.) EXHIBIT 1-A Future value (compounded sum) of $1 after a given number of time periods 10% 1.100 17% 1.110 1.210 12:32 1331 1 154 1.368 1518 1718 1620 Period 1% 1 2010 2 1.020 1030 1041 1051 1.062 1,072 1083 1004 1.105 1,116 1.127 13 1.130 1149 1.161 1.173 17 1184 18 1.196 19 1.208 20 1.220 25 1.282 301.348 10 1.480 50 1645 2% 3% 4% 5% 1020 1030 1000 1050 1.040 1061 10821.103 1061 1095 1.125 10821.126 1.170 1.216 2104 1.150 1217 1.276 1.126 1.194 1.265 1.340 1.149 1230 1316 1.407 1.1721267 1.369 1.477 105 1305 1.551 12191 1.490 1 243 1114 1539 1710 128 1476 1601 1. 200 1400 1665 10 1319 15732180 1513 14 15 1801 2019 1375 1605 2165 1400 1653 1.948 2292 1428 1.702 2 026 2407 1.457 1.754 2.107 3527 14 TAS 2101 2653 1.641 2 004 1811 2.427 3.243 .322 2.208 322 4.01 7040 2.402 4.384 7.107 11.45) 6% 7% 8% 9% 1.000 1.000 1.000 1.000 1.124 1145 1166 1.183 1.191 1.260 1.295 1362 1311 1412 139 1.003 1.40 1.539 1410 1501 1504 1606 1714 1820 1.594 1851 1003 1000 1050 1000 2172 1701 1067 2150 247 1808 2105 2012 2252 2518 2815 2135 240 2720 3000 2579 2017 2007 2750 31 5602 25.00 5970 2693 5159 2854 3580 3026 3617 316 5102 3.207 5604 25.07 . 8425 5.73 76121006 15268 10 26 14974 2 1735 51.000 18.420 22.457 48902 72358 1.611 1772 19.49 214 2358 2504 2 153 148 3452 1797 4177 1685 1870 2076 2305 2558 2839 152 3498 3003 4310 5 1511 5.054 5.1895 6116 743 67270 105 TS 17.40 5.250 1 17.390 22892 65.001 184570 Period 14 15 16 17% 30 30% 1 2 1170 1.300 162 1180 1302 163 1 190 1410 200 1400 7 28 250 150s LOSS 300 1000 2197 3 2.192 3511 4108 3157 10 5160 564 17 1 .120 1130 1140 1150 1160 1.254 1.2771300 1323 130 1.405 1443 14821521 1.561 1.574 1630 1680 1762 142 1925 2011 2100 1.974 2082 2105 2.211 2353 2502 2.660 2006 2.476 3059 3004 3.106 3.305 3707 40 4411 30 3.06 4363 BOB 5492 61538 4887 7.076 5.474 266 6.130 7057 21 107 6.856 7986 276 10761 1 1024 10575 12.375 1 8.613 10.197 120 1423216777 900 11523 13743 laser 10001 17.000 21231 20402 32.910 60 874 20 960 39.116 50950 66.212 SO 93051 152.730 370 3720 209.000 4500000 1000 1000 7600 0.007 10530 12 50 01 110 B03915 50 10.699 18190 1140 12830 22737 0 15.02 .02 5118 2 22 27 32000 77 3 10.74 2521 23.100 27303 50 1110 TO 100 10 25 30 13 38504 23 3 198 99 190 sasso 750 190.000 396 34700 705 50 150 250 000 0 751300 119000 100 000 9799 000 15 0 EXHIBIT 1-B Future value (compounded sum) of $1 paid in at the end of each period for a given number of time periods (an annuity) Period 2 4122 5.101 7 8 2% 3% 4% 5% 6% 1.000 1.000 1.000 1.000 1.000 1.000 1.000 1.000 1.000 2010 2020 2030 2000 2000 2000 2010 2000 2000 3030 3000 3091 3122 3.153 3 154 3215 326 3278 4 DSO 246 5 5.204 5300 5416 5.526 5637 5.751 5867 5 985 6152 6 308 6.468 6633 6 802 6.975 7.153 7336 7523 721474547278988142 394 8.654 8.925 9200 RSS 802 9214 999 99 100 10437 1108 w 7 55 1019 103 11027 1141 11 978128 13021 10 10 950 11.454 1200512578 13181 13.816 47 15193 11.567 12.169 12.08 13.406 14.207 14972 15.754 16645 17560 12 3 13.412 14192 15026 15 917 16.570 17 1 8 977 20141 13809 1 4680 1 5618 16.627 17.713 18.882 20.141 21.495 22.953 14947 15.974 17086 18.292 10.500 21015 22.550 24215 26.019 160971793 18.59920024 21.579 23276 25.129 27.152 29.361 17.258 18.639 20.157 21825 2365725673 27 50 324 53005 20012 2 1762 23.698 25840 28213 30 30 33.750 $6974 19015 21412 23414 25.045 28.132 30 906 3 37.50 41 501 20811 2241 25.117 27671 30 539 3576073 4 1 018 24.297 26870 20778 3 3056 36786 0905 45 762 51.140 28 243 32050 36.50 54.365 33 73106 01 45 10.558 SAS 66.439 2008 04451 11370 136 310 60402 75.401 95.026 120 300 154.760 190 6.40 259.000 337890 64.463 4579 112.800. 152670 209 350 290 340 606 530 573.770 815.080 10% 1.000 1.000 2100 2110 3310 3342 4710 6 105 6228 7716 7913 9.487 783 114 11 859 13579 14164 15937 16722 1855119.561 21 4 22 713 24525 26212 27.975 30.005 31.772 4.405 3 5950 39.190 10 545 501 55 5039 S1150 54999 10 11 13 14 15 18.430 22019 08 114419 10000 164.490 2.500 1.16.3.200 1.668.800 Period 14776 15.416 ESPERSES **** 12% 13% 14% 15% 16% 17% 18% 19% 20% 25% 30% 1000 1000 1000 1000 1.000 1.000 1000 1000 1000 1000 1000 2120 2130 2140 2150 2 160 2170 2100 2.190 2200 2350 2300 3374 1.407 403.473350635393572 5606 S 1 3 990 USO 021 403 5.066 5.141 5215 5.915 7 19 6.40 6.610 676 6.877 7014 7.154 7297 742 2 07 11581333 8536 754 977 9207 42 6 3 99301120 12756 1000 10.405 10.730 11067 11414 11.772 12.142 12.523 12916 15.073 17583 12.300 12.757 13233 1 3727 14.240 1 4773 15327 15.902 16.499 19 342 23.858 16.085 1676 17.519 18205 1906 19023 20.700 25 12 32015 12.540 18.420 19337 20304 21.321 22 393 23521 2 4701 25.950 333 20655 21.814 23.045 24349 30.04 32.150 506 56.405 25.650 27271 20002 50 850 32 34 349317180 4 30 28.029 29.985 320 4352 676 30.00 2219 97625 32.303 43 781 67 103 184341 01 127910 37280 4 | 0 0 0 0 0 167290 42.753 46.672 90 55717 60 925 66 64 729397 30 8740 138.110 218.70 48.54 55 730 50.118 5.0 TS 71.675 78970 87058 05.022 105.930 173.60 285010 55.750 61.725 66394 75.836 4141 93.406 10740 115.270 128.120218050 371.520 63.440 70.749 78.969 8212 9 8.603 110200123410 138 170 15,70 273.560 483.970 72.052 0.947 01025 103.40 115 1 3000 1440 165.620 186.600 342.950 6.30-170 133.330 155.620 181.870 212.700 249 210 292.110 4200 400040 471 900 1014 NO 2548 800 241330 295.200 3547904470530310 40 50 700 1.181.9003727.2008 730 000 767000013700 134.000 100 2360001545004161105 300 7343.00 30.000000 120.393.000 2.400 000 1450 500 4045007217100 10000 15000 11000 115000 45.497000 8054000 165.976 000 50