

Answered step by step
Verified Expert Solution
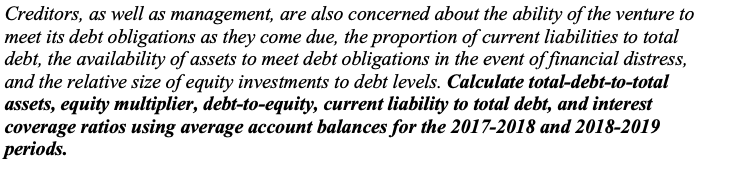
Question
1 Approved Answer
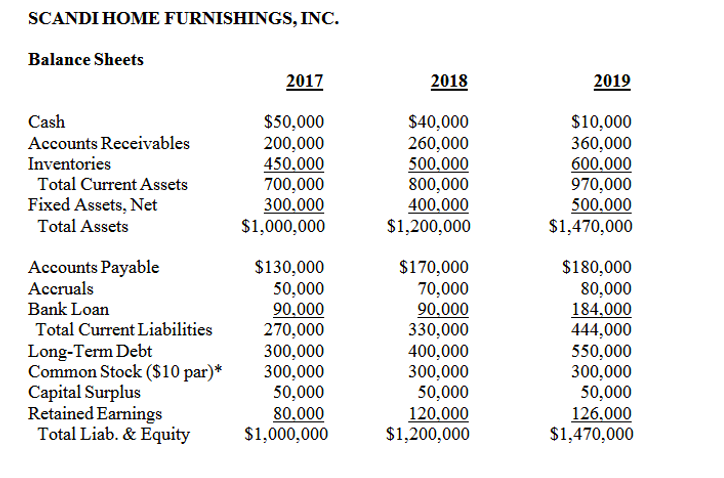
SCANDI HOME FURNISHINGS, INC. Balance Sheets 2017 2018 2019 Cash Accounts Receivables Inventories Total Current Assets Fixed Assets, Net Total Assets $50,000 200,000 450,000 700,000
Step by Step Solution
There are 3 Steps involved in it
Step: 1

Get Instant Access to Expert-Tailored Solutions
See step-by-step solutions with expert insights and AI powered tools for academic success
Step: 2

Step: 3
Ace Your Homework with AI
Get the answers you need in no time with our AI-driven, step-by-step assistance
Get Started
Bank Valuation And Value Based Management Deposit And Loan Pricing Performance Evaluation And Risk
Authors: Jean Dermine
2nd Edition
0071839488,0071839496