

Answered step by step
Verified Expert Solution
Question
1 Approved Answer
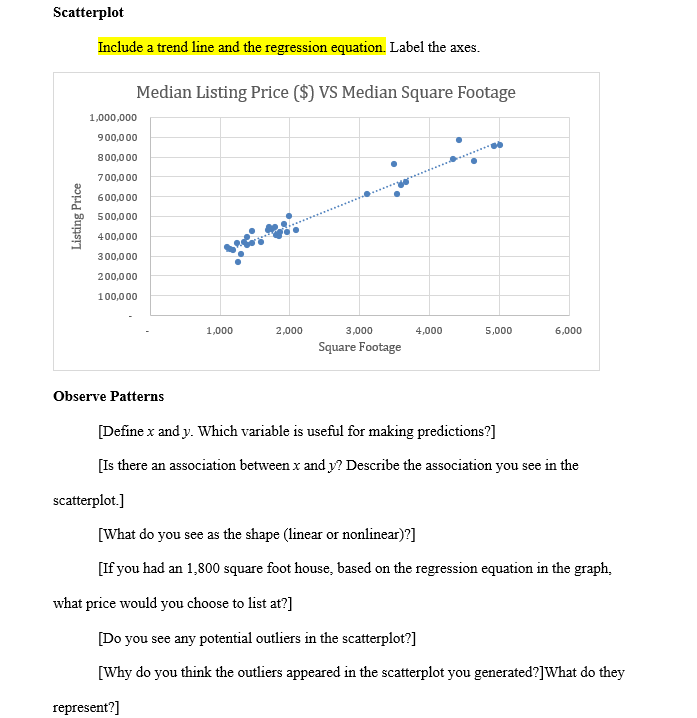
Scatterplot Include a trend line and the regression equation. Label the axes. Median Listing Price ($) VS Median Square Footage 1,000,000 300,000 * - 800,000
Step by Step Solution
There are 3 Steps involved in it
Step: 1

Get Instant Access to Expert-Tailored Solutions
See step-by-step solutions with expert insights and AI powered tools for academic success
Step: 2

Step: 3
Ace Your Homework with AI
Get the answers you need in no time with our AI-driven, step-by-step assistance
Get Started
Discrete and Combinatorial Mathematics An Applied Introduction
Authors: Ralph P. Grimaldi
5th edition
201726343, 978-0201726343