Answered step by step
Verified Expert Solution
Link Copied!

Question

1 Approved Answer

Scenario #4 - The last several charts have been showing story point burn down. This is a burn up chart. Explain why the charts are
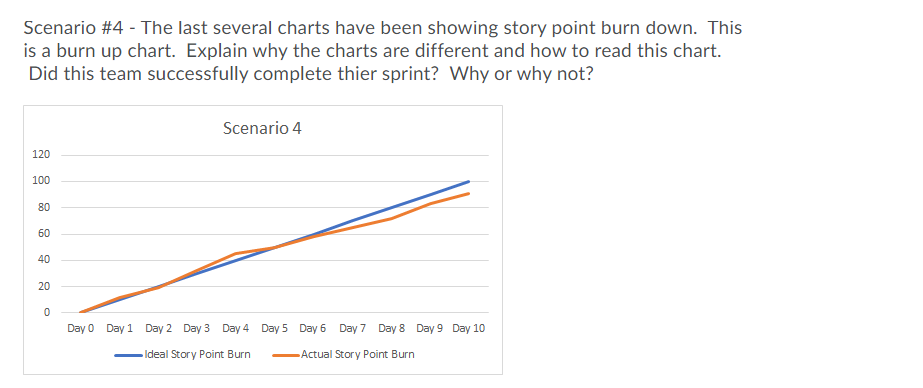
image text in transcribed
Scenario #4 - The last several charts have been showing story point burn down. This is a burn up chart. Explain why the charts are different and how to read this chart. Did this team successfully complete thier sprint? Why or why not? Scenario 4 120 100 80 60 40 20 0 Day 0 Day 1 Day 2 Day 3 Day 4 Day 5 Day 6 Day 7 Day & Day 9 Day 10 -Ideal Story Point Burn -Actual Story Point Burn

Step by Step Solution

There are 3 Steps involved in it

Step: 1

blur-text-image

Get Instant Access to Expert-Tailored Solutions

See step-by-step solutions with expert insights and AI powered tools for academic success

Step: 2

blur-text-image

Step: 3

blur-text-image

Ace Your Homework with AI

Get the answers you need in no time with our AI-driven, step-by-step assistance

Get Started

Recommended Textbook for

Matching Supply with Demand An Introduction to Operations Management

Authors: Gerard Cachon, Christian Terwiesch

3rd edition

73525200, 978-0073525204

More Books

Students also viewed these General Management questions

Question

Computing option greeks (Haug (2007)).

Answered: 1 week ago

Question

The maximum number of electrons in a shell can be?

Answered: 1 week ago

Question

True or false The entire human population shows variations?

Answered: 1 week ago

Question

National park in India?

Answered: 1 week ago

Question

How did the guard ant recognise this ant ?

Answered: 1 week ago