

Answered step by step
Verified Expert Solution
Question
1 Approved Answer
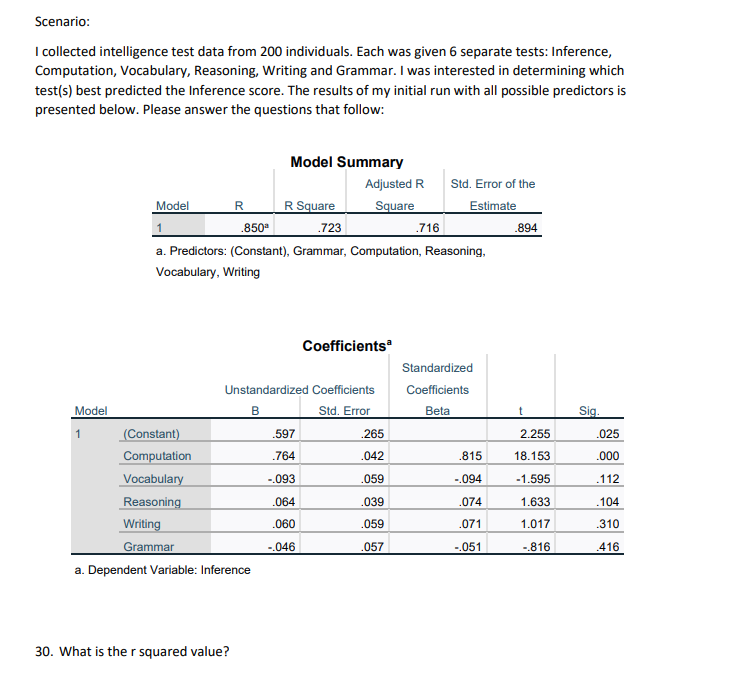
Scenario: I collected intelligence test data from 200 individuals. Each was given 6 separate tests: Inference, Computation, Vocabulary, Reasoning, Writing and Grammar. I was interested
Step by Step Solution
There are 3 Steps involved in it
Step: 1

Get Instant Access to Expert-Tailored Solutions
See step-by-step solutions with expert insights and AI powered tools for academic success
Step: 2

Step: 3
Ace Your Homework with AI
Get the answers you need in no time with our AI-driven, step-by-step assistance
Get Started
Fundamentals Of Calculus
Authors: Carla C Morris, Robert M Stark
1st Edition
1119015367, 9781119015369