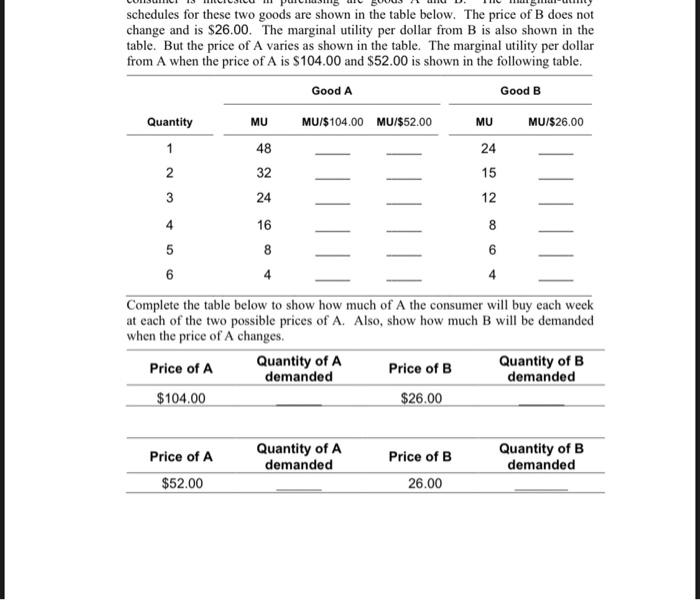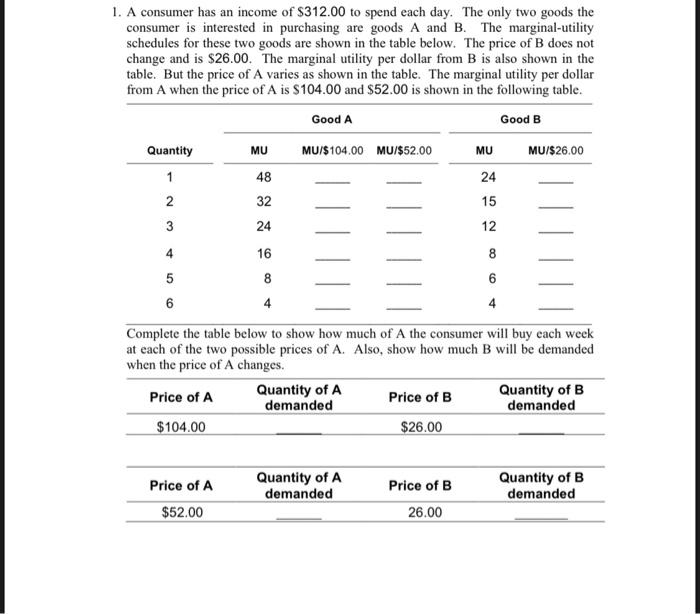
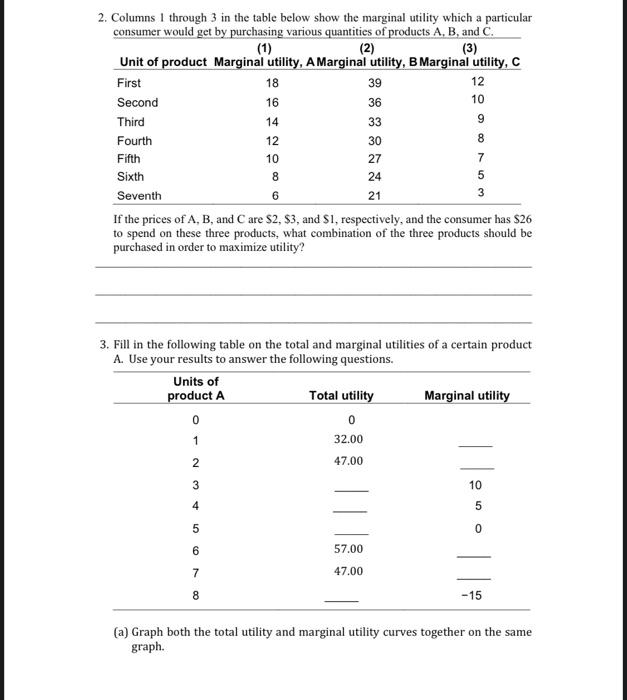
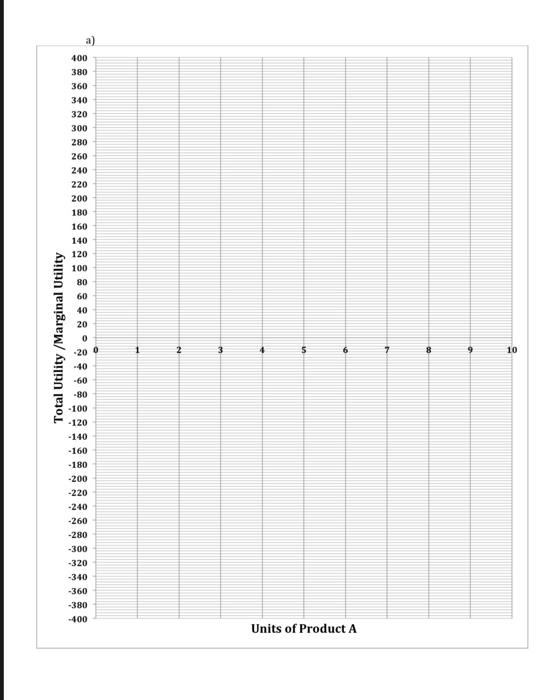
schedules for these two goods are shown in the table below. The price of B does not change and is $26.00. The marginal utility per dollar from B is also shown in the table. But the price of A varies as shown in the table. The marginal utility per dollar from A when the price of A is $104.00 and $52.00 is shown in the following table. Good A Good B Quantity MU MU/$104.00 MU/$52.00 MU MU/$26.00 1 24 2 32 15 3 24 12 48 4 16 8 6 5 6 8 4 Complete the table below to show how much of A the consumer will buy each week at each of the two possible prices of A. Also, show how much will be demanded when the price of A changes. Price of A Quantity of A Price of B Quantity of B demanded demanded $104.00 $26.00 Price of A $52.00 Quantity of A demanded Price of B 26.00 Quantity of B demanded 1. A consumer has an income of $312.00 to spend each day. The only two goods the consumer is interested in purchasing are goods A and B. The marginal-utility schedules for these two goods are shown in the table below. The price of B does not change and is $26.00. The marginal utility per dollar from B is also shown in the table. But the price of A varies as shown in the table. The marginal utility per dollar from A when the price of A is $104.00 and $52.00 is shown in the following table. Good A Good B Quantity MU/$104.00 MU/$52.00 MU/$26.00 1 48 24 2 32 15 MU MU 3 24 12 4 16 8 6 6 6 5 6 8 4 Complete the table below to show how much of A the consumer will buy each week at each of the two possible prices of A. Also, show how much will be demanded when the price of A changes. Price of A Quantity of A demanded Price of B Quantity of B demanded $104.00 $26.00 Price of A $52.00 Quantity of A demanded Price of B 26.00 Quantity of B demanded (2) (3) 2. Columns 1 through 3 in the table below show the marginal utility which a particular consumer would get by purchasing various quantities of products A, B, and C. Unit of product Marginal utility, A Marginal utility, B Marginal utility, C First 18 39 12 Second 16 36 10 Third 14 33 9 Fourth 12 30 8 Fifth 10 27 7 Sixth 8 24 5 Seventh 6 21 3 If the prices of A, B, and Care S2, S3, and S1, respectively, and the consumer has $26 to spend on these three products, what combination of the three products should be purchased in order to maximize utility? 3. Fill in the following table on the total and marginal utilities of a certain product A. Use your results to answer the following questions. Units of product A Total utility Marginal utility 0 1 32.00 0 2 47.00 3 10 4 5 | | 250 | | 5 0 6 57.00 7 47.00 8 -15 (a) Graph both the total utility and marginal utility curves together on the same graph. a) 400 380 360 340 320 300 280 260 240 220 Total Utility /Marginal Utility 2 3 5 . 8 10 200 180 160 140 120 100 80 60 40 20 0 -20 -40 -60 -80 -100 -120 - 140 - 160 -180 -200 -220 -240 -260 -280 -300 -320 -340 -360 -380 -400 Units of Product A (b) Explain the shape of both of the curves. C) Identify the point where utility is maximized on both curves. Discuss the reasoning behind each value. schedules for these two goods are shown in the table below. The price of B does not change and is $26.00. The marginal utility per dollar from B is also shown in the table. But the price of A varies as shown in the table. The marginal utility per dollar from A when the price of A is $104.00 and $52.00 is shown in the following table. Good A Good B Quantity MU MU/$104.00 MU/$52.00 MU MU/$26.00 1 24 2 32 15 3 24 12 48 4 16 8 6 5 6 8 4 Complete the table below to show how much of A the consumer will buy each week at each of the two possible prices of A. Also, show how much will be demanded when the price of A changes. Price of A Quantity of A Price of B Quantity of B demanded demanded $104.00 $26.00 Price of A $52.00 Quantity of A demanded Price of B 26.00 Quantity of B demanded 1. A consumer has an income of $312.00 to spend each day. The only two goods the consumer is interested in purchasing are goods A and B. The marginal-utility schedules for these two goods are shown in the table below. The price of B does not change and is $26.00. The marginal utility per dollar from B is also shown in the table. But the price of A varies as shown in the table. The marginal utility per dollar from A when the price of A is $104.00 and $52.00 is shown in the following table. Good A Good B Quantity MU/$104.00 MU/$52.00 MU/$26.00 1 48 24 2 32 15 MU MU 3 24 12 4 16 8 6 6 6 5 6 8 4 Complete the table below to show how much of A the consumer will buy each week at each of the two possible prices of A. Also, show how much will be demanded when the price of A changes. Price of A Quantity of A demanded Price of B Quantity of B demanded $104.00 $26.00 Price of A $52.00 Quantity of A demanded Price of B 26.00 Quantity of B demanded (2) (3) 2. Columns 1 through 3 in the table below show the marginal utility which a particular consumer would get by purchasing various quantities of products A, B, and C. Unit of product Marginal utility, A Marginal utility, B Marginal utility, C First 18 39 12 Second 16 36 10 Third 14 33 9 Fourth 12 30 8 Fifth 10 27 7 Sixth 8 24 5 Seventh 6 21 3 If the prices of A, B, and Care S2, S3, and S1, respectively, and the consumer has $26 to spend on these three products, what combination of the three products should be purchased in order to maximize utility? 3. Fill in the following table on the total and marginal utilities of a certain product A. Use your results to answer the following questions. Units of product A Total utility Marginal utility 0 1 32.00 0 2 47.00 3 10 4 5 | | 250 | | 5 0 6 57.00 7 47.00 8 -15 (a) Graph both the total utility and marginal utility curves together on the same graph. a) 400 380 360 340 320 300 280 260 240 220 Total Utility /Marginal Utility 2 3 5 . 8 10 200 180 160 140 120 100 80 60 40 20 0 -20 -40 -60 -80 -100 -120 - 140 - 160 -180 -200 -220 -240 -260 -280 -300 -320 -340 -360 -380 -400 Units of Product A (b) Explain the shape of both of the curves. C) Identify the point where utility is maximized on both curves. Discuss the reasoning behind each value
