

Answered step by step
Verified Expert Solution
Question
1 Approved Answer
Scores in the Rose Bowl The data show the scores of the winning teams in the Rose Bowl. Construct a frequency distribution for the
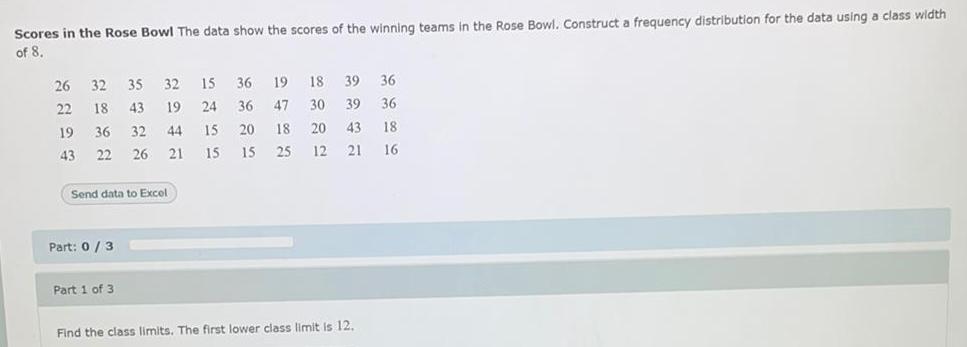
Scores in the Rose Bowl The data show the scores of the winning teams in the Rose Bowl. Construct a frequency distribution for the data using a class width of 8. 26 32 35 32 15 36 19 18 39 36 22 18 43 19 24 36 47 30 39 36 19 36 32 44 15 20 18 20 43 18 43 22 26 21 15 15 25 12 21 16 Send data to Excel Part: 0/3 Part 1 of 3 Find the class limits. The first lower class limit is 12.
Step by Step Solution
There are 3 Steps involved in it
Step: 1

Get Instant Access to Expert-Tailored Solutions
See step-by-step solutions with expert insights and AI powered tools for academic success
Step: 2

Step: 3
Ace Your Homework with AI
Get the answers you need in no time with our AI-driven, step-by-step assistance
Get Started
Surfaces In Classical Geometries A Treatment By Moving Frames
Authors: Gary R Jensen, Emilio Musso, Lorenzo Nicolodi
1st Edition
3319270761, 9783319270760