

Question
Section 1: GDP expenditure and income calculations. Here are two tables of the different indicators used in the calculation of the GDP of the imaginary
Section 1: GDP expenditure and income calculations.
Here are two tables of the different indicators used in the calculation of the GDP of the imaginary country KvQ
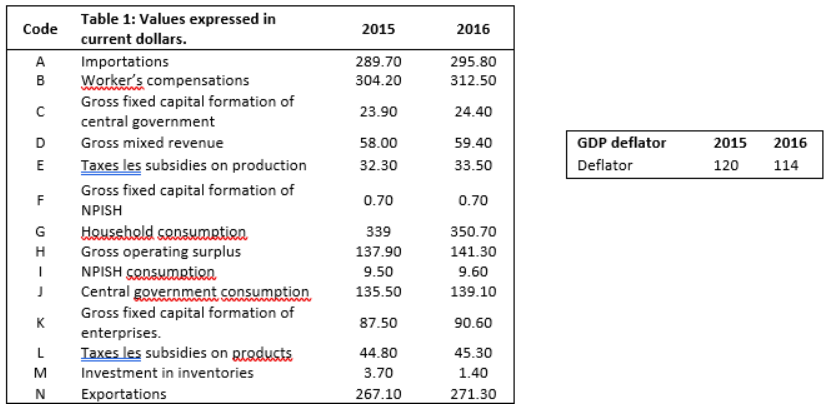
1. For 2015 and 2016, calculate GDP using the expenditure and income methods. Leave traces of your calculations by using the codes on the left column EX: A+B+S+D+F+G=345.
|
| Formula using codes | Result for 2015 | Result for 2016 |
| GDP expenditure |
|
|
|
| GDP income |
|
|
|
- If necessary, calculate the statistical discrepancy to get a final GDP number and leave traces of your calculations. If not necessary, leave this question blank
|
| Calculation for 2015 | Calculation for 2016 |
| Statistical discrepancy |
|
|
| Final GDP number |
|
|
- Regarding cross -sectional analysis, calculate estimations for the two measurements asked in the table. Leave traces of your calculations.
|
| 2015 | 2016 |
| Weight of all spending in capital goods and services (do not include inventories) |
|
|
| Weight of Small and Medium Enterprises in GDP |
|
|
- Calculate the following indicators and leave traces of your calculations.
| Real GDP in 2015
|
| Real GDP in 2016
|
| Year growth rate in 2016
|
| Year inflation in 2016 |
- Annual inflation in 2016 as measured by the CPI was -1.00%. Compare this percentage you found in the previous question and answer: why are these two numbers different?
- Explain the difference between nominal and real GDP. In your argument, you should use the word scale of measurement.
Step by Step Solution
There are 3 Steps involved in it
Step: 1

Get Instant Access to Expert-Tailored Solutions
See step-by-step solutions with expert insights and AI powered tools for academic success
Step: 2

Step: 3
Ace Your Homework with AI
Get the answers you need in no time with our AI-driven, step-by-step assistance
Get Started
Succeeding in Business with Microsoft Excel 2013 A Problem Solving Approach
Authors: Debra Gross, Frank Akaiwa, Karleen Nordquist
1st edition
978-1285099149, 9781285963969, 1285099141, 1285963962, 978-1285715346