

Answered step by step
Verified Expert Solution
Question
1 Approved Answer
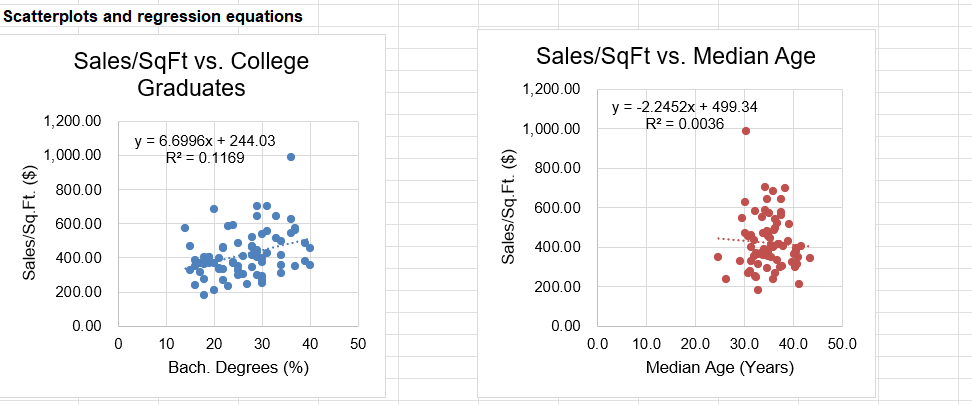
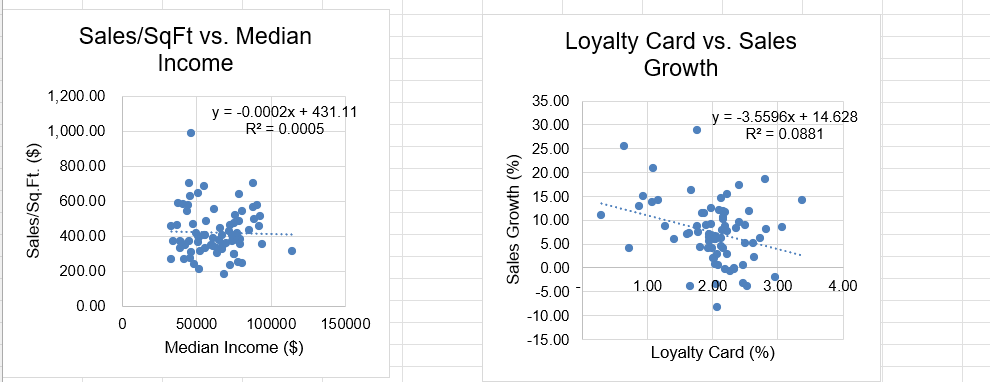
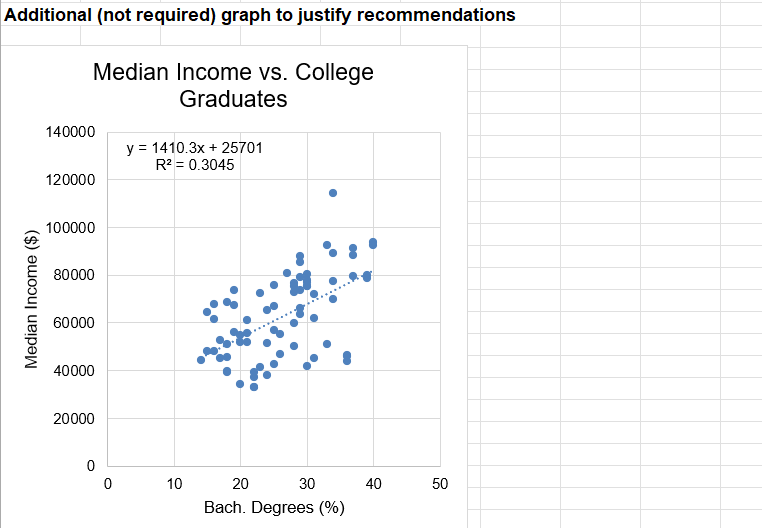
Section 2: Analysis Interpret the scatter plots and designate the type of relationship using regression parameters (increasing/positive, decreasingegative, or no relationship) observed in each one.
Section 2: Analysis
- Interpret the scatter plots and designate the type of relationship using regression parameters (increasing/positive, decreasingegative, or no relationship) observed in each one.
- Determine what you can conclude from these relationships. You need to include a copy of each chart in your report.
Section 3: Expansion Criteria
- What are the expansion criteria and why?
Section 4: Recommendations and Implementation;
- Based on the findings, assess which expansion criteria seem to be more effective. Could any expansion criterion be changed or eliminated? If so, which one(s) and why?
- Based on the findings, does it appear as if the loyalty card is positively correlated with sales growth? Would you recommend any changes to this marketing strategy?
- Based on the findings, recommend market positioning that targets a specific demographic. (Hint: Are younger people patronizing the restaurants more than older people?)
- Include how the local culture and communities are represented in your market position in your recommendations.
- Indicate what information should be collected to track and evaluate the effectiveness of your recommendations. How can this data be collected? (Hint: Would you use surveys/samples or census?)
Step by Step Solution
There are 3 Steps involved in it
Step: 1

Get Instant Access to Expert-Tailored Solutions
See step-by-step solutions with expert insights and AI powered tools for academic success
Step: 2

Step: 3
Ace Your Homework with AI
Get the answers you need in no time with our AI-driven, step-by-step assistance
Get Started
Finite Mathematics and Its Applications
Authors: Larry J. Goldstein, David I. Schneider, Martha J. Siegel, Steven Hair
12th edition
978-0134768588, 9780134437767, 134768582, 134437764, 978-0134768632