Section 2. Ratio Analysis (35 points)
Identify the appropriate formula and calculate the following ratios for the most recent two fiscal years (Market performance ratios (earnings per share, book value per share, price-earnings ratio, and dividend yield are already computed and included in the template.)
NOTE: You will need to use the previous years reports in order to calculate averages where applicable.
Complete the following ratios in the Excel template:
- Measures of liquidity
- Working capital
- Current ratio
- Quick ratio
- Inventory turnover
- Average days to sell inventory
- Measures of solvency
- Debt to assets
- Debt to equity
- Number of times interest earned
- Plant assets to long-term liabilities
- Measures of profitability
- Net margin (return on sales)
- Asset turnover
- Return on investment
- Return on equity
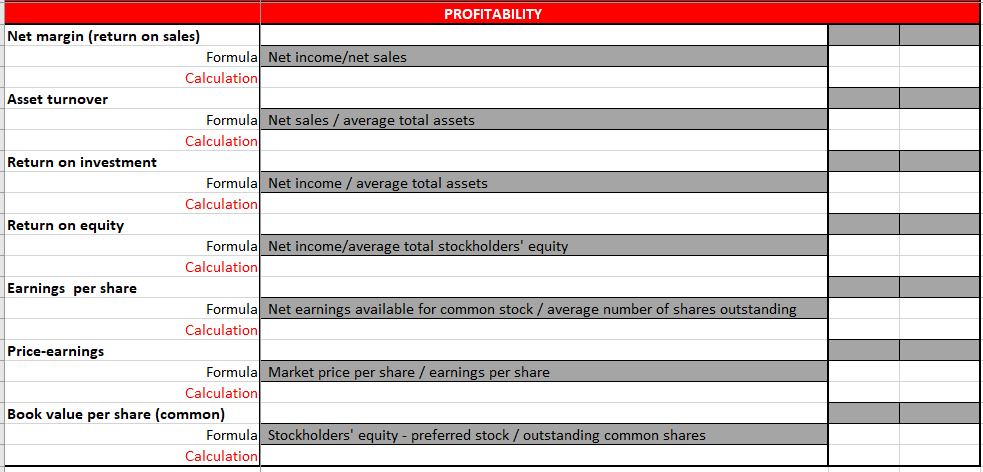

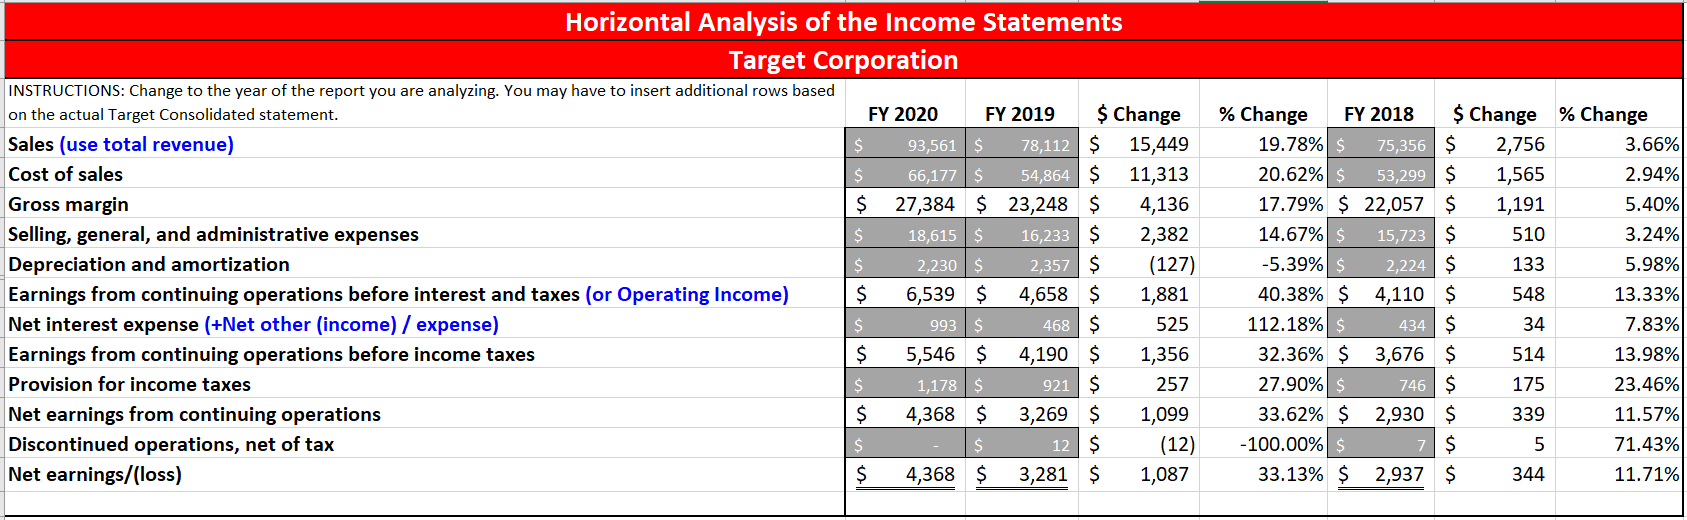
PROFITABILITY Net margin (return on sales) Formula Net incomeet sales Calculation Asset turnover Formula Net sales / average total assets Calculation Return on investment Formula Net income / average total assets Calculation Return on equity Formula Net income/average total stockholders' equity Calculation Earnings per share Formula Net earnings available for common stock / average number of shares outstanding Calculation Price-earnings Formula Market price per share / earnings per share Calculation Book value per share (common) Formula Stockholders' equity - preferred stock / outstanding common shares Calculation % 6,02% 21.02% 3.12% 30.16% Vertical Analysis - Balance Sheets Target Corporation INSTRUCTIONS: Change the year of the report you are analyzing. You may have to insert additional rows based on the actual Target Consolidated statement. FY 2020 % FY 2019 ASSETS Cash and cash equivalents 8,511 0.166075$ 2,577 Inventory 10,653 0.207872 $ 8,992 Other current assets 1,592 0.031065 $ 1,333 Total current assets 20,756 0.405011 $ 12,902 Property and equipment 0 Land 6,141 0.119829 $ 6,036 Buildings and equipment 31,557 0.61577 $ 30,603 Fixtures and equipment 5,914 0.1154 $ 6,083 Computer hardware and software 2,765 0.053953 $ 2,692 Construction-in-progress 780 0.01522 $ 533 Accumulated depreciation $ (20,278) -0.39568 $ (19,664) Property and equipment, net $ 26,879 0.524489 $ 26,283 Operating lease assets 2,227 0.043455 $ 2,236 Other noncurrent assets 1,386 0.027045 $ 1,358 Total assets $ 51,248 100.00% $ 42,779 LIABILITIES Accounts payable 12,859 0.250917 $ 9,920 Accrued and other current liabilities 6,122 0.119458 S 4.406 Current portion of long-term debt and other borrowings 1,144 0.022323 $ 161 Total current liabilities 20,1250.392698 $ 14,487 Long-term debt and other borrowings 11,536 0.225101 $ 11,338 Noncurrent operating lease liabilities 2,218 0.04328 $ 2,275 Deferred income taxes 990 0.019318$ 1,122 Other noncurrent liabilities 1,939 0.037836 $ 1,724 Total noncurrent liabilities $ 16,683 0.325535 $ 16,459 Total liabilities $ 36,8080.718233 $ 30,946 SHAREHOLDERS' INVESTMENT Common stock 42 0.000825 42 Additional paid-in capital 6,329 0.123498 $ 6,226 Retained earnings 8,825 0.172202 $ 6,433 Accumulated other comprehensive loss (756 -0.01475 $ (868) Total shareholders' investment $ 14,440 0.281767 $ 11,833 Total liabilities and shareholders' investment $ 51,248 100.00% $ 42,779 0.00% 14.11% 71.54% 14.22% 6.29% 1.25% -45.97% 61.44% 5.23% 3.17% 100.00% 23.19% 10.30% 0.38% 33.86% 26.50% 5.32% 2.62% 4.03% 38.47% 72.34% 0.10% 14.55% 15.04% -2.03% 27.66% 100.00% Horizontal Analysis of the Income Statements Target Corporation INSTRUCTIONS: Change to the year of the report you are analyzing. You may have to insert additional rows based on the actual Target Consolidated statement. FY 2020 FY 2019 $ Change Sales (use total revenue) $ 93,561$ 78,112 $ 15,449 Cost of sales $ 66,177 $ 54,864 $ 11,313 Gross margin $ 27,384 $ 23,248 $ 4,136 Selling, general, and administrative expenses $ 18,615$ 16,233 $ 2,382 Depreciation and amortization $ 2,230$ 2,357 $ (127) Earnings from continuing operations before interest and taxes (or Operating Income) $ 6,539 $ 4,658 $ 1,881 Net interest expense (+Net other (income) / expense) $ 993$ 468 $ 525 Earnings from continuing operations before income taxes $ 5,546 $ 4,190 $ 1,356 Provision for income taxes $ 1,178 $ 921 $ 257 Net earnings from continuing operations $ 4,368 $ 3,269 $ 1,099 Discontinued operations, net of tax $ $ 12 $ (12) Net earnings/(loss) $ 4,368 $ 3,281 $ 1,087 % Change FY 2018 $ Change % Change 19.78% $ 75,356 $ 2,756 3.66% 20.62% $ 53,299 $ 1,565 2.94% 17.79% $ 22,057 $ 1,191 5.40% 14.67% $ 15,723 $ 510 3.24% -5.39% 2,224 $ 133 5.98% 40.38% $ 4,110 $ 548 13.33% 112.18% $ 434 $ 34 7.83% 32.36% $ 3,676 $ 514 13.98% 27.90% $ 746 $ 175 23.46% 33.62% $ 2,930 $ 339 11.57% - 100.00% $ 7 $ 5 71.43% 33.13% $ 2,937 $ 344 11.71%