

The following case study has been extracted from IATA (2008) report on Air Travel Demand. According...
Fantastic news! We've Found the answer you've been seeking!
Question:
Transcribed Image Text:
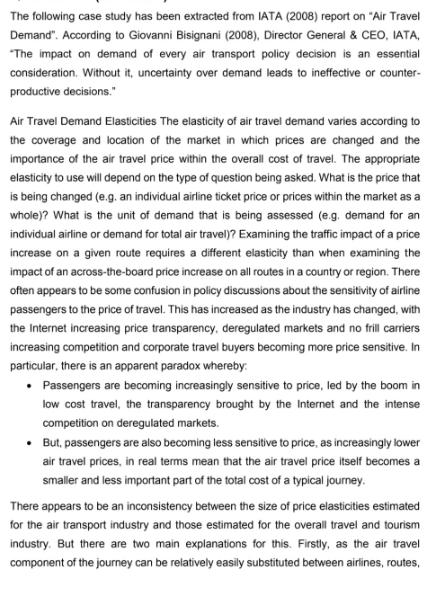
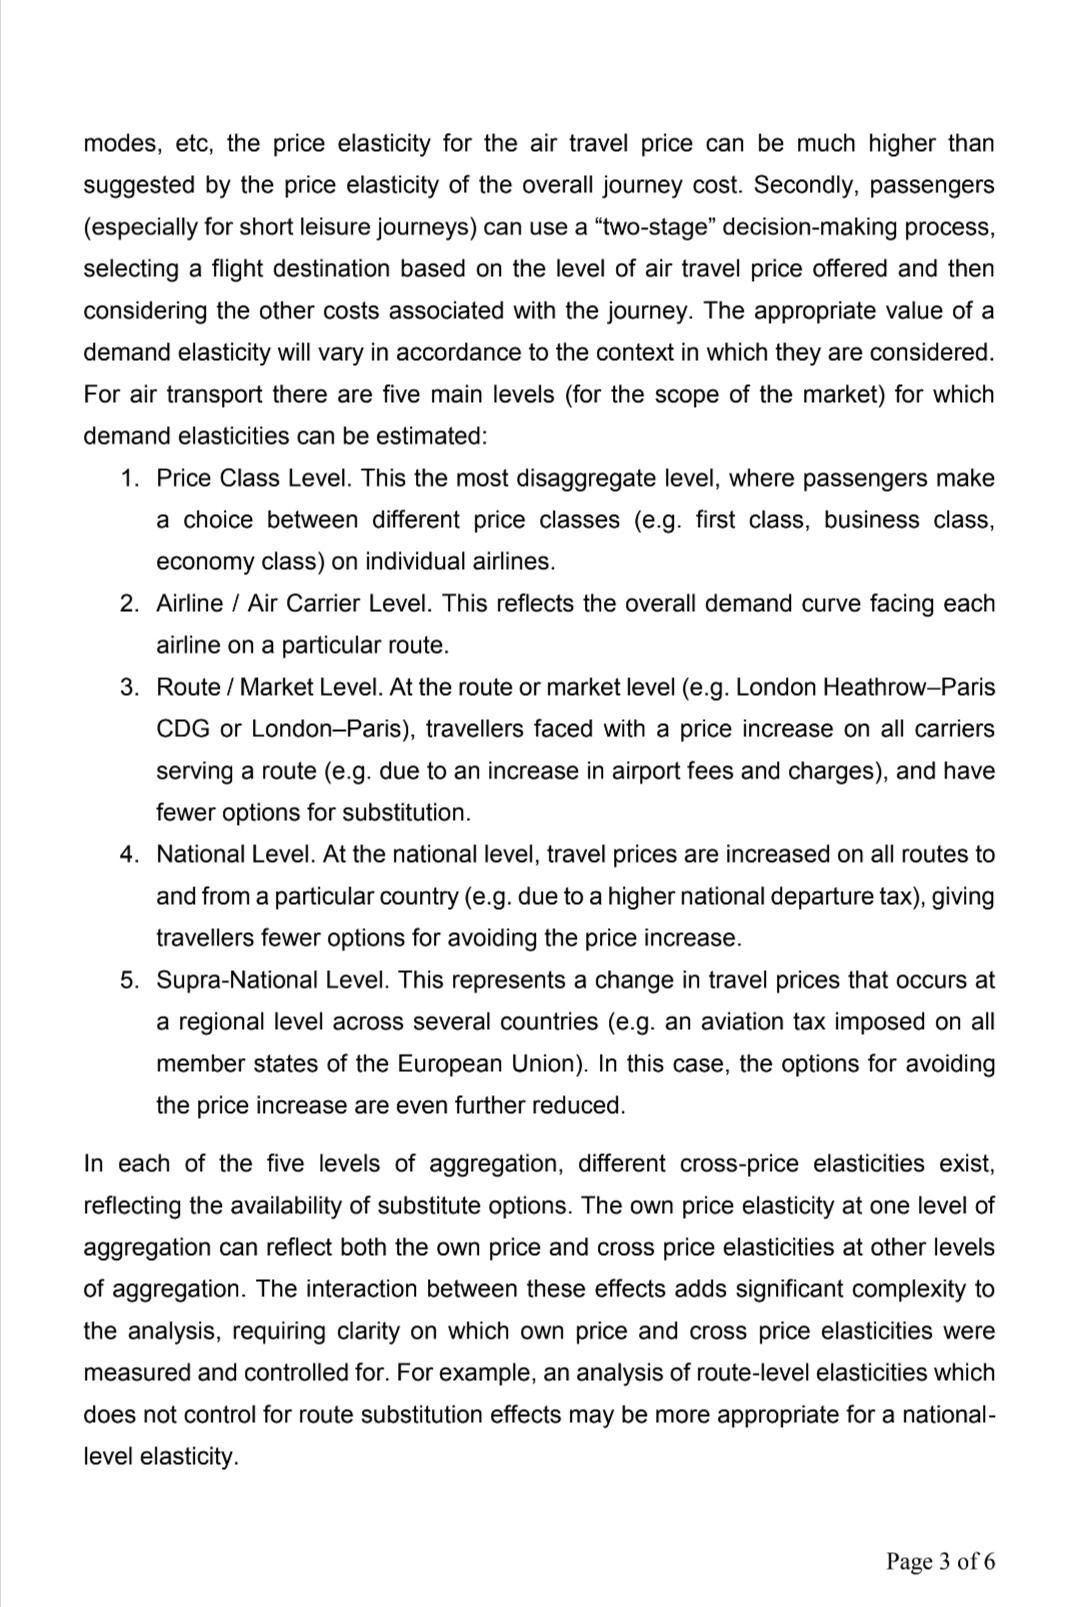
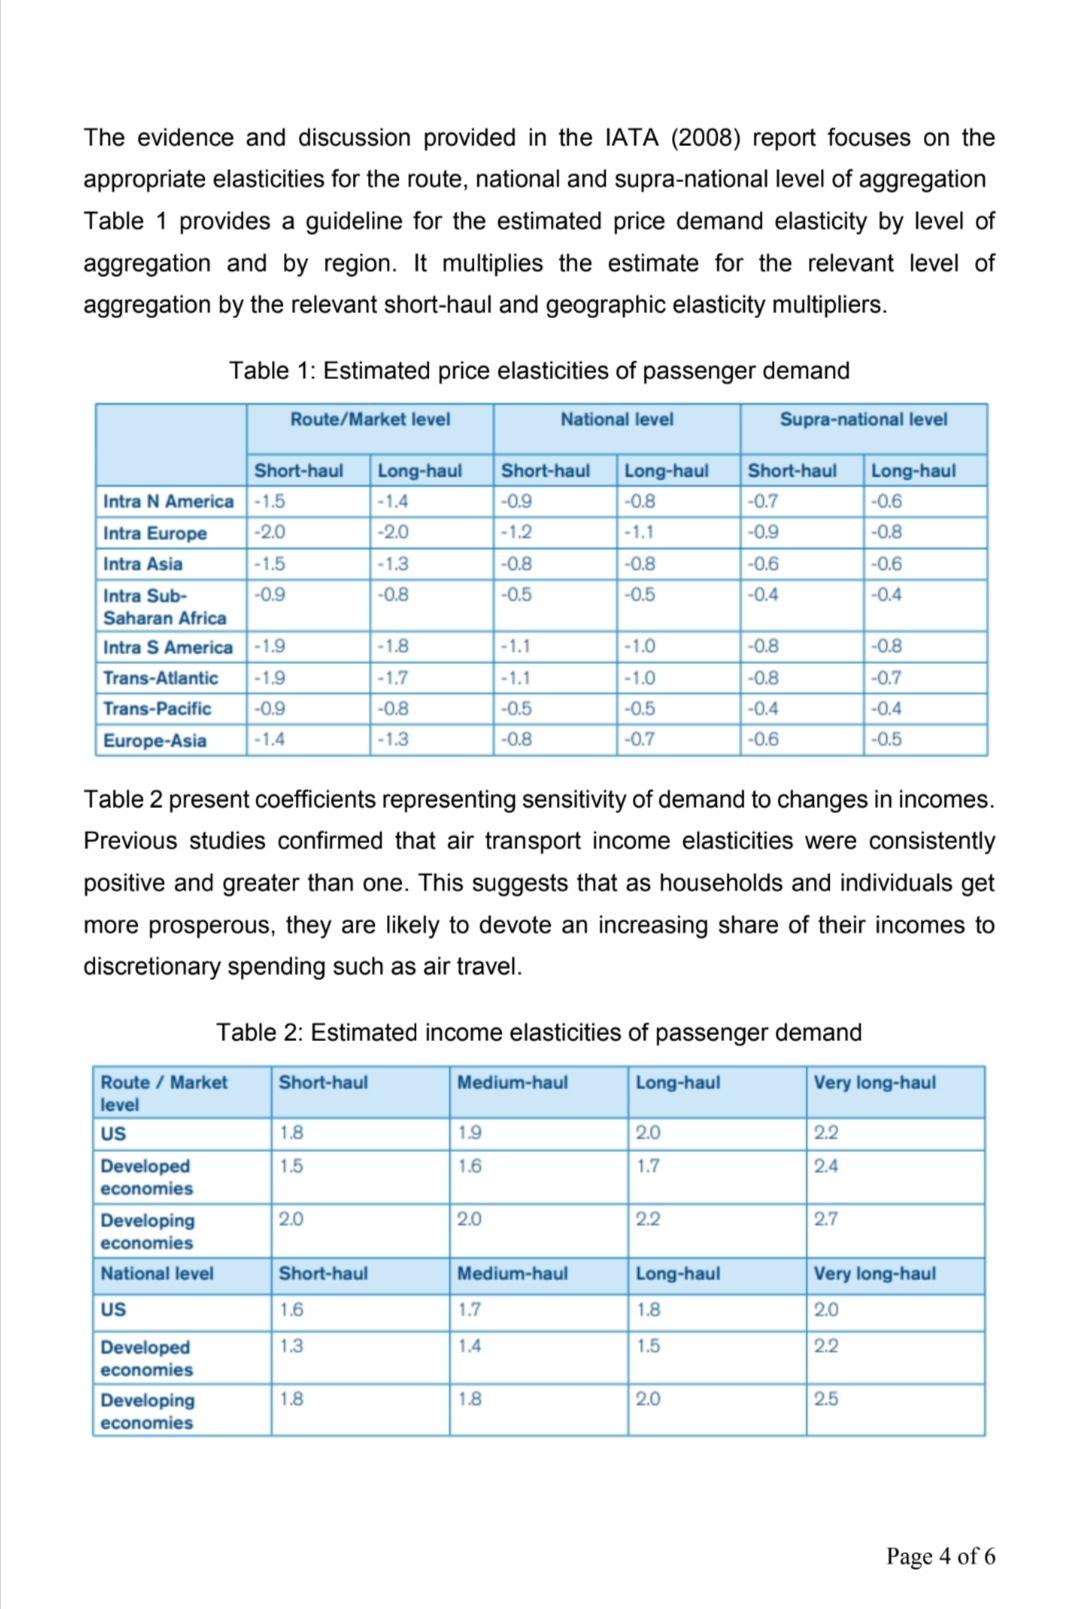
The following case study has been extracted from IATA (2008) report on "Air Travel Demand". According to Giovanni Bisignani (2008), Director General & CEO, IATA, "The impact on demand of every air transport policy decision is an essential consideration. Without it, uncertainty over demand leads to ineffective or counter- productive decisions." Air Travel Demand Elasticities The elasticity of air travel demand varies according to the coverage and location of the market in which prices are changed and the importance of the air travel price within the overall cost of travel. The appropriate elasticity to use will depend on the type of question being asked. What is the price that is being changed (e.g. an individual airline ticket price or prices within the market as a whole)? What is the unit of demand that is being assessed (e.g. demand for an individual airline or demand for total air travel)? Examining the traffic impact of a price increase on a given route requires a different elasticity than when examining the impact of an across-the-board price increase on all routes in a country or region. There often appears to be some confusion in policy discussions about the sensitivity of airline passengers to the price of travel. This has increased as the industry has changed, with the Internet increasing price transparency, deregulated markets and no frill carriers increasing competition and corporate travel buyers becoming more price sensitive. In particular, there is an apparent paradox whereby: • Passengers are becoming increasingly sensitive to price, led by the boom in low cost travel, the transparency brought by the Internet and the intense competition on deregulated markets. • But, passengers are also becoming less sensitive to price, as increasingly lower air travel prices, in real terms mean that the air travel price itself becomes a smaller and less important part of the total cost of a typical journey. There appears to be an inconsistency between the size of price elasticities estimated for the air transport industry and those estimated for the overall travel and tourism industry. But there are two main explanations for this. Firstly, as the air travel component of the journey can be relatively easily substituted between airlines, routes, modes, etc, the price elasticity for the air travel price can be much higher than suggested by the price elasticity of the overall journey cost. Secondly, passengers (especially for short leisure journeys) can use a "two-stage" decision-making process, selecting a flight destination based on the level of air travel price offered and then considering the other costs associated with the journey. The appropriate value of a demand elasticity will vary in accordance to the context in which they are considered. For air transport there are five main levels (for the scope of the market) for which demand elasticities can be estimated: 1. Price Class Level. This the most disaggregate level, where passengers make a choice between different price classes (e.g. first class, business class, economy class) on individual airlines. 2. Airline / Air Carrier Level. This reflects the overall demand curve facing each airline on a particular route. 3. Route / Market Level. At the route or market level (e.g. London Heathrow-Paris CDG or London-Paris), travellers faced with a price increase on all carriers serving a route (e.g. due to an increase in airport fees and charges), and have fewer options for substitution. 4. National Level. At the national level, travel prices are increased on all routes to and from a particular country (e.g. due to a higher national departure tax), giving travellers fewer options for avoiding the price increase. 5. Supra-National Level. This represents a change in travel prices that occurs at a regional level across several countries (e.g. an aviation tax imposed on all member states of the European Union). In this case, the options for avoiding the price increase are even further reduced. In each of the five levels of aggregation, different cross-price elasticities exist, reflecting the availability of substitute options. The own price elasticity at one level of aggregation can reflect both the own price and cross price elasticities at other levels of aggregation. The interaction between these effects adds significant complexity to the analysis, requiring clarity on which own price and cross price elasticities were measured and controlled for. For example, an analysis of route-level elasticities which does not control for route substitution effects may be more appropriate for a national- level elasticity. Page 3 of 6 The evidence and discussion provided in the IATA (2008) report focuses on the appropriate elasticities for the route, national and supra-national level of aggregation Table 1 provides a guideline for the estimated price demand elasticity by level of aggregation and by region. It multiplies the estimate for the relevant level of aggregation by the relevant short-haul and geographic elasticity multipliers. Table 1: Estimated price elasticities of passenger demand Route/Market level National level Supra-national level Short-haul Long-haul Short-haul Long-haul Short-haul Long-haul Intra N America -1.5 -1.4 -0.9 -0.8 -0.7 -0.6 Intra Europe -2.0 -2.0 -1.2 -1.1 -0.9 -0.8 Intra Asia -1.5 -1.3 -0.8 -0.8 -0.6 -0.6 Intra Sub- Saharan Africa -0.9 -0.8 -0.5 -0.5 -0.4 -0.4 Intra S America -1.9 -1.8 -1.1 -1.0 -0.8 -0.8 Trans-Atlantic -1.9 -1.7 -1.1 -1.0 -0.8 -0.7 Trans-Pacific -0.9 -0.8 -0.5 -0.5 -0.4 -0.4 Europe-Asia -1.4 -1.3 -0.8 -0.7 -0.6 -0.5 Table 2 present coefficients representing sensitivity of demand to changes in incomes. Previous studies confirmed that air transport income elasticities were consistently positive and greater than one. This suggests that as households and individuals get more prosperous, they are likely to devote an increasing share of their incomes to discretionary spending such as air travel. Table 2: Estimated income elasticities of passenger demand Route / Market Short-haul Medium-haul Long-haul Very long-haul level US 1.8 1.9 2.0 2.2 Developed economies 1.5 1.6 1.7 2.4 Developing 2.0 2.0 2.2 2.7 economies National level Short-haul Medium-haul Long-haul Very long-haul US 1.6 1.7 1.8 2.0 Developed economies 1.3 1.4 1.5 2.2 Developing 1.8 1.8 2.0 2.5 economies Page 4 of 6 Required: (a) Discuss the main implications for (i) price elasticities, and (ii) income elasticities of passenger demand. [1000 words] (10 marks) (b) As regards price discrimination and/or exploitation, what factors are most significant in determining pricing strategy according to the case study? [1000 words] (15 marks) (c) According to you, what additional factors can be considered in order to better measure price and income elasticities of passenger demand. [1000 words] (15 marks) The following case study has been extracted from IATA (2008) report on "Air Travel Demand". According to Giovanni Bisignani (2008), Director General & CEO, IATA, "The impact on demand of every air transport policy decision is an essential consideration. Without it, uncertainty over demand leads to ineffective or counter- productive decisions." Air Travel Demand Elasticities The elasticity of air travel demand varies according to the coverage and location of the market in which prices are changed and the importance of the air travel price within the overall cost of travel. The appropriate elasticity to use will depend on the type of question being asked. What is the price that is being changed (e.g. an individual airline ticket price or prices within the market as a whole)? What is the unit of demand that is being assessed (e.g. demand for an individual airline or demand for total air travel)? Examining the traffic impact of a price increase on a given route requires a different elasticity than when examining the impact of an across-the-board price increase on all routes in a country or region. There often appears to be some confusion in policy discussions about the sensitivity of airline passengers to the price of travel. This has increased as the industry has changed, with the Internet increasing price transparency, deregulated markets and no frill carriers increasing competition and corporate travel buyers becoming more price sensitive. In particular, there is an apparent paradox whereby: • Passengers are becoming increasingly sensitive to price, led by the boom in low cost travel, the transparency brought by the Internet and the intense competition on deregulated markets. • But, passengers are also becoming less sensitive to price, as increasingly lower air travel prices, in real terms mean that the air travel price itself becomes a smaller and less important part of the total cost of a typical journey. There appears to be an inconsistency between the size of price elasticities estimated for the air transport industry and those estimated for the overall travel and tourism industry. But there are two main explanations for this. Firstly, as the air travel component of the journey can be relatively easily substituted between airlines, routes, modes, etc, the price elasticity for the air travel price can be much higher than suggested by the price elasticity of the overall journey cost. Secondly, passengers (especially for short leisure journeys) can use a "two-stage" decision-making process, selecting a flight destination based on the level of air travel price offered and then considering the other costs associated with the journey. The appropriate value of a demand elasticity will vary in accordance to the context in which they are considered. For air transport there are five main levels (for the scope of the market) for which demand elasticities can be estimated: 1. Price Class Level. This the most disaggregate level, where passengers make a choice between different price classes (e.g. first class, business class, economy class) on individual airlines. 2. Airline / Air Carrier Level. This reflects the overall demand curve facing each airline on a particular route. 3. Route / Market Level. At the route or market level (e.g. London Heathrow-Paris CDG or London-Paris), travellers faced with a price increase on all carriers serving a route (e.g. due to an increase in airport fees and charges), and have fewer options for substitution. 4. National Level. At the national level, travel prices are increased on all routes to and from a particular country (e.g. due to a higher national departure tax), giving travellers fewer options for avoiding the price increase. 5. Supra-National Level. This represents a change in travel prices that occurs at a regional level across several countries (e.g. an aviation tax imposed on all member states of the European Union). In this case, the options for avoiding the price increase are even further reduced. In each of the five levels of aggregation, different cross-price elasticities exist, reflecting the availability of substitute options. The own price elasticity at one level of aggregation can reflect both the own price and cross price elasticities at other levels of aggregation. The interaction between these effects adds significant complexity to the analysis, requiring clarity on which own price and cross price elasticities were measured and controlled for. For example, an analysis of route-level elasticities which does not control for route substitution effects may be more appropriate for a national- level elasticity. Page 3 of 6 The evidence and discussion provided in the IATA (2008) report focuses on the appropriate elasticities for the route, national and supra-national level of aggregation Table 1 provides a guideline for the estimated price demand elasticity by level of aggregation and by region. It multiplies the estimate for the relevant level of aggregation by the relevant short-haul and geographic elasticity multipliers. Table 1: Estimated price elasticities of passenger demand Route/Market level National level Supra-national level Short-haul Long-haul Short-haul Long-haul Short-haul Long-haul Intra N America -1.5 -1.4 -0.9 -0.8 -0.7 -0.6 Intra Europe -2.0 -2.0 -1.2 -1.1 -0.9 -0.8 Intra Asia -1.5 -1.3 -0.8 -0.8 -0.6 -0.6 Intra Sub- Saharan Africa -0.9 -0.8 -0.5 -0.5 -0.4 -0.4 Intra S America -1.9 -1.8 -1.1 -1.0 -0.8 -0.8 Trans-Atlantic -1.9 -1.7 -1.1 -1.0 -0.8 -0.7 Trans-Pacific -0.9 -0.8 -0.5 -0.5 -0.4 -0.4 Europe-Asia -1.4 -1.3 -0.8 -0.7 -0.6 -0.5 Table 2 present coefficients representing sensitivity of demand to changes in incomes. Previous studies confirmed that air transport income elasticities were consistently positive and greater than one. This suggests that as households and individuals get more prosperous, they are likely to devote an increasing share of their incomes to discretionary spending such as air travel. Table 2: Estimated income elasticities of passenger demand Route / Market Short-haul Medium-haul Long-haul Very long-haul level US 1.8 1.9 2.0 2.2 Developed economies 1.5 1.6 1.7 2.4 Developing 2.0 2.0 2.2 2.7 economies National level Short-haul Medium-haul Long-haul Very long-haul US 1.6 1.7 1.8 2.0 Developed economies 1.3 1.4 1.5 2.2 Developing 1.8 1.8 2.0 2.5 economies Page 4 of 6 Required: (a) Discuss the main implications for (i) price elasticities, and (ii) income elasticities of passenger demand. [1000 words] (10 marks) (b) As regards price discrimination and/or exploitation, what factors are most significant in determining pricing strategy according to the case study? [1000 words] (15 marks) (c) According to you, what additional factors can be considered in order to better measure price and income elasticities of passenger demand. [1000 words] (15 marks)
Expert Answer:
Answer rating: 100% (QA)
This report has revealed that there are different price elasticities associated with different uses When consumers are choosing between airlines on a route or even between destinations for holidays co... View the full answer

Related Book For 

Intermediate Accounting
ISBN: 978-0324300987
10th Edition
Authors: Loren A Nikolai, D. Bazley and Jefferson P. Jones
Posted Date:
Students also viewed these economics questions
-
The following trial balance has been extracted from the ledger of Andrea Howell, a sole trader, as at 31 May 20X3, the end of her most recent financial year. The following additional information as...
-
The following information has been extracted from the draft financial statements of TEX, a manufacturing entity: TEX - Income statement for the year ended 30 September 2003 September 2003...
-
The following information has been extracted from the accounting records of the Atwood Corporation: 1. Cash on hand (undeposited sales receipts) ............ $ 1,020 2. Certificates of deposit...
-
Find the struggles faced by business (printed t-shirts) with suppliers? Explain what would be the communication plan for each stakeholder and how you'll implement the decision you have taken?
-
What are the major components of a management control system?
-
Elton Company manufactures wheel rims. The controller budgeted the following ABC allocation rates for 2012: The number of parts is now a feasible allocation base because Elton recently purchased bar...
-
Kimiko Company's standard labor cost per unit of output is $ 1 8 (2 hours X \($9.00\) per hour). During August, the company incurs 1,850 hours of direct labor at an hourly cost of \($9.60\) per hour...
-
Kirsten Neal is interested in purchasing a new house given that mortgage rates are at a historical low. Her bank has specific rules regarding an applicants ability to meet the contractual payments...
-
If A is a 5 x 5-matrix with det(A) = -3 what is the determinant of 2A-3 2
-
Cinder Inc. is a Canadian-controlled private corporation based in your province. The company operates a wholesale business. The following information is provided for its year ended May 31, 2020: 1....
-
Factiva leased equipment that had retail cash selling price of 9 0 0 , 0 0 0 and useful life of five years with no residual value for a lease term of five years. The lessor paid 8 6 0 , 0 0 0 to...
-
At TripAdvisor, a global travel website with user-generated reviews and opinions , competition within the global travel industry remains cutthroat and intense. Steve Kaufer is the co-founder and CEO...
-
As technology becomes more pervasive, new and complex ethical issues have arisen in the workplace, which have contributed to ethical and, at times, legal challenges for employers and employees....
-
Warren Buffett is a world-famous investor and CEO of conglomerate Berkshire Hathaway, which includes companies as diverse as Kraft Heinz, Geico Auto Insurance, and Benjamin Moore Paints. Buffett...
-
Take the company you chose for question 2 (or choose another), and search for information about the company's social and environmental responsibility practices. Some companies publish annual...
-
In an effort to solve some of the world's most pressing problems, Mark Zuckerberg and his wife Dr. Priscilla Chan created a philanthropic organization to pledge 99% of their shares in Facebook. The...
-
The following data are accumulated by Geddes Company in evaluating the purchase of $130,000 of equipment, having a four-year useful life: Net Income Net Cash Flow Year 1 $42,000 Year 2 20,000 Year 3...
-
Cobb Manufacturing Company uses a process cost system and average costing. The following production data is for the month of June 2011. Production Costs Work in process, beginning of the month:...
-
On November 21, 2007 a fire at Hodge Companys warehouse caused severe damage to its entire inventory of Product Tex. Hodge estimates that all usable damaged goods can be sold for $10,000. The...
-
You are auditing the financial records of a company and you are aware that it has grown quickly in the last few years by acquiring other companies. You look up the disclosure in last years annual...
-
What is a bond? Define face value, maturity date, contract rate, bond certificate, and bond indenture.
-
What maximum price would you be willing to pay for an annual coupon bond with 12 years remaining until maturity, an 8 percent coupon rate, and a YTM of 11 percent? a. $805.23 b. $908.65 c. $923.67 d....
-
You are evaluating a project with the following cash flows. How many IRRs might there be? a. 4 or less b. 4 exactly c. 4 or more d. 5 or less Time 0 1 2 3 4 5 Cash Flow -100 75 100 -35 70 100 -100
-
In May 2002, the budget committee of Sherrick Stoics assembles the following data in preparation ol budgeted merchandise purchases lor the month ol June. I Expected sales: June \($500,000\). July...

Study smarter with the SolutionInn App