Answered step by step
Verified Expert Solution
Question
1 Approved Answer
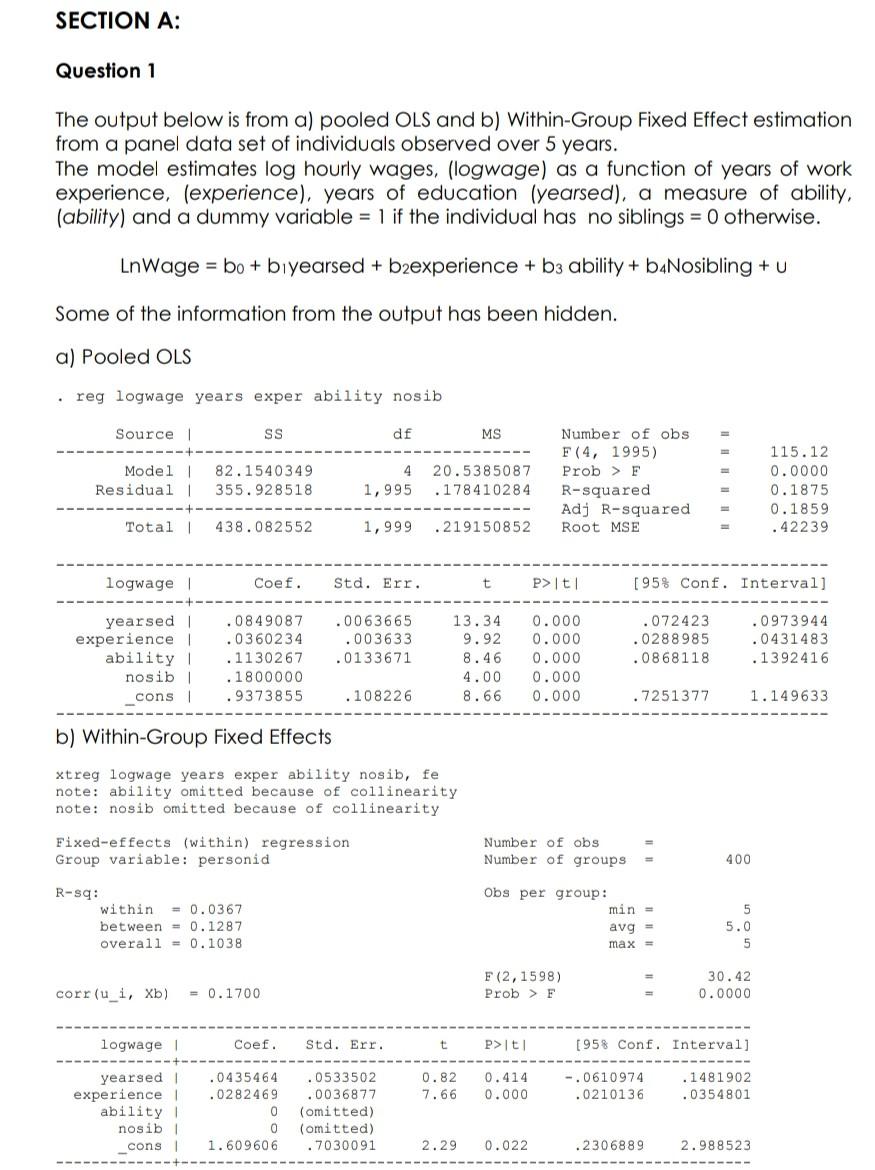
SECTION A: Question 1 The output below is from a) pooled OLS and b) Within-Group Fixed Effect estimation from a panel data set of individuals


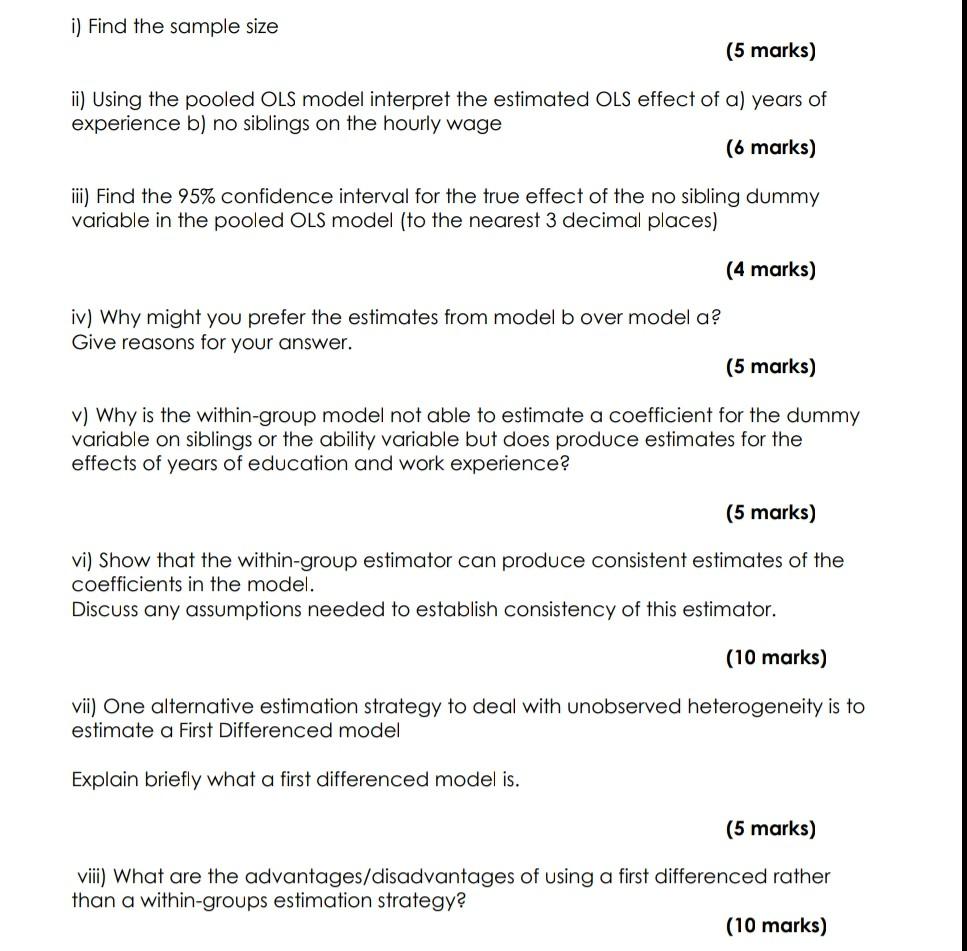
SECTION A: Question 1 The output below is from a) pooled OLS and b) Within-Group Fixed Effect estimation from a panel data set of individuals observed over 5 years. The model estimates log hourly wages, (logwage) as a function of years of work experience, (experience), years of education (yearsed), a measure of ability, (ability) and a dummy variable = 1 if the individual has no siblings = 0 otherwise. LnWage = bo + byearsed + b2experience + b3 ability + b Nosibling +U Some of the information from the output has been hidden. a) Pooled OLS reg logwage years exper ability nosib Source SS df MS Model 1 Residual 82.1540349 355.928518 4 1,995 20.5385087 .178410284 Number of obs F (4, 1995) Prob > F R-squared Adj R-squared Root MSE 115.12 0.0000 0.1875 0.1859 .42239 Total 438.082552 1,999 .219150852 logwage 1 Coef. Std. Err. t P>It! [95% Conf. Interval] yearsed experience ability 1 nosib cons .0849087 .0360234 . 1130267 .1800000 .9373855 .0063665 .003633 .0133671 13.34 9.92 8.46 4.00 8.66 0.000 0.000 0.000 0.000 0.000 .072423 .0288985 .0868118 0973944 .0431483 .1392416 . 108226 .7251377 1.149633 b) Within-Group Fixed Effects xtreg logwage years exper ability nosib, fe note: ability omitted because of collinearity note: nosib omitted because of collinearity Fixed-effects (within) regression Group variable: personid Number of obs Number of groups 400 R-s: within = 0.0367 between = 0.1287 overall = 0.1038 Obs per group: min avg = 5 5.0 5 max = F(2,1598) Prob > F 30.42 0.0000 corr(u_i, Xb) = 0.1700 logwage 1 Coef. Std. Err. t P>t [958 Conf. Interval] 0.82 7.66 0.414 0.000 -.0610974 .0210136 .1481902 .0354801 yearsed experience ability nosib cons .0435464 .0282469 0 0 1.609606 .0533502 .0036877 (omitted) (omitted) . 7030091 2.29 0.022 .2306889 2.988523 i) Find the sample size (5 marks) ii) Using the pooled OLS model interpret the estimated OLS effect of a) years of experience b) no siblings on the hourly wage (6 marks) iii) Find the 95% confidence interval for the true effect of the no sibling dummy variable in the pooled OLS model (to the nearest 3 decimal places) (4 marks) iv) Why might you prefer the estimates from model b over model a? Give reasons for your answer. (5 marks) v) Why is the within-group model not able to estimate a coefficient for the dummy variable on siblings or the ability variable but does produce estimates for the effects of years of education and work experience? (5 marks) vi) Show that the within-group estimator can produce consistent estimates of the coefficients in the model. Discuss any assumptions needed to establish consistency of this estimator. (10 marks) vii) One alternative estimation strategy to deal with unobserved heterogeneity is to estimate a First Differenced model Explain briefly what a first differenced model is. (5 marks) viii) What are the advantages/disadvantages of using a first differenced rather than a within-groups estimation strategy? (10 marks) SECTION A: Question 1 The output below is from a) pooled OLS and b) Within-Group Fixed Effect estimation from a panel data set of individuals observed over 5 years. The model estimates log hourly wages, (logwage) as a function of years of work experience, (experience), years of education (yearsed), a measure of ability, (ability) and a dummy variable = 1 if the individual has no siblings = 0 otherwise. LnWage = bo + byearsed + b2experience + b3 ability + b Nosibling +U Some of the information from the output has been hidden. a) Pooled OLS reg logwage years exper ability nosib Source SS df MS Model 1 Residual 82.1540349 355.928518 4 1,995 20.5385087 .178410284 Number of obs F (4, 1995) Prob > F R-squared Adj R-squared Root MSE 115.12 0.0000 0.1875 0.1859 .42239 Total 438.082552 1,999 .219150852 logwage 1 Coef. Std. Err. t P>It! [95% Conf. Interval] yearsed experience ability 1 nosib cons .0849087 .0360234 . 1130267 .1800000 .9373855 .0063665 .003633 .0133671 13.34 9.92 8.46 4.00 8.66 0.000 0.000 0.000 0.000 0.000 .072423 .0288985 .0868118 0973944 .0431483 .1392416 . 108226 .7251377 1.149633 b) Within-Group Fixed Effects xtreg logwage years exper ability nosib, fe note: ability omitted because of collinearity note: nosib omitted because of collinearity Fixed-effects (within) regression Group variable: personid Number of obs Number of groups 400 R-s: within = 0.0367 between = 0.1287 overall = 0.1038 Obs per group: min avg = 5 5.0 5 max = F(2,1598) Prob > F 30.42 0.0000 corr(u_i, Xb) = 0.1700 logwage 1 Coef. Std. Err. t P>t [958 Conf. Interval] 0.82 7.66 0.414 0.000 -.0610974 .0210136 .1481902 .0354801 yearsed experience ability nosib cons .0435464 .0282469 0 0 1.609606 .0533502 .0036877 (omitted) (omitted) . 7030091 2.29 0.022 .2306889 2.988523 i) Find the sample size (5 marks) ii) Using the pooled OLS model interpret the estimated OLS effect of a) years of experience b) no siblings on the hourly wage (6 marks) iii) Find the 95% confidence interval for the true effect of the no sibling dummy variable in the pooled OLS model (to the nearest 3 decimal places) (4 marks) iv) Why might you prefer the estimates from model b over model a? Give reasons for your answer. (5 marks) v) Why is the within-group model not able to estimate a coefficient for the dummy variable on siblings or the ability variable but does produce estimates for the effects of years of education and work experience? (5 marks) vi) Show that the within-group estimator can produce consistent estimates of the coefficients in the model. Discuss any assumptions needed to establish consistency of this estimator. (10 marks) vii) One alternative estimation strategy to deal with unobserved heterogeneity is to estimate a First Differenced model Explain briefly what a first differenced model is. (5 marks) viii) What are the advantages/disadvantages of using a first differenced rather than a within-groups estimation strategy? (10 marks)
Step by Step Solution
There are 3 Steps involved in it
Step: 1

Get Instant Access to Expert-Tailored Solutions
See step-by-step solutions with expert insights and AI powered tools for academic success
Step: 2

Step: 3

Ace Your Homework with AI
Get the answers you need in no time with our AI-driven, step-by-step assistance
Get Started


