Answered step by step
Verified Expert Solution
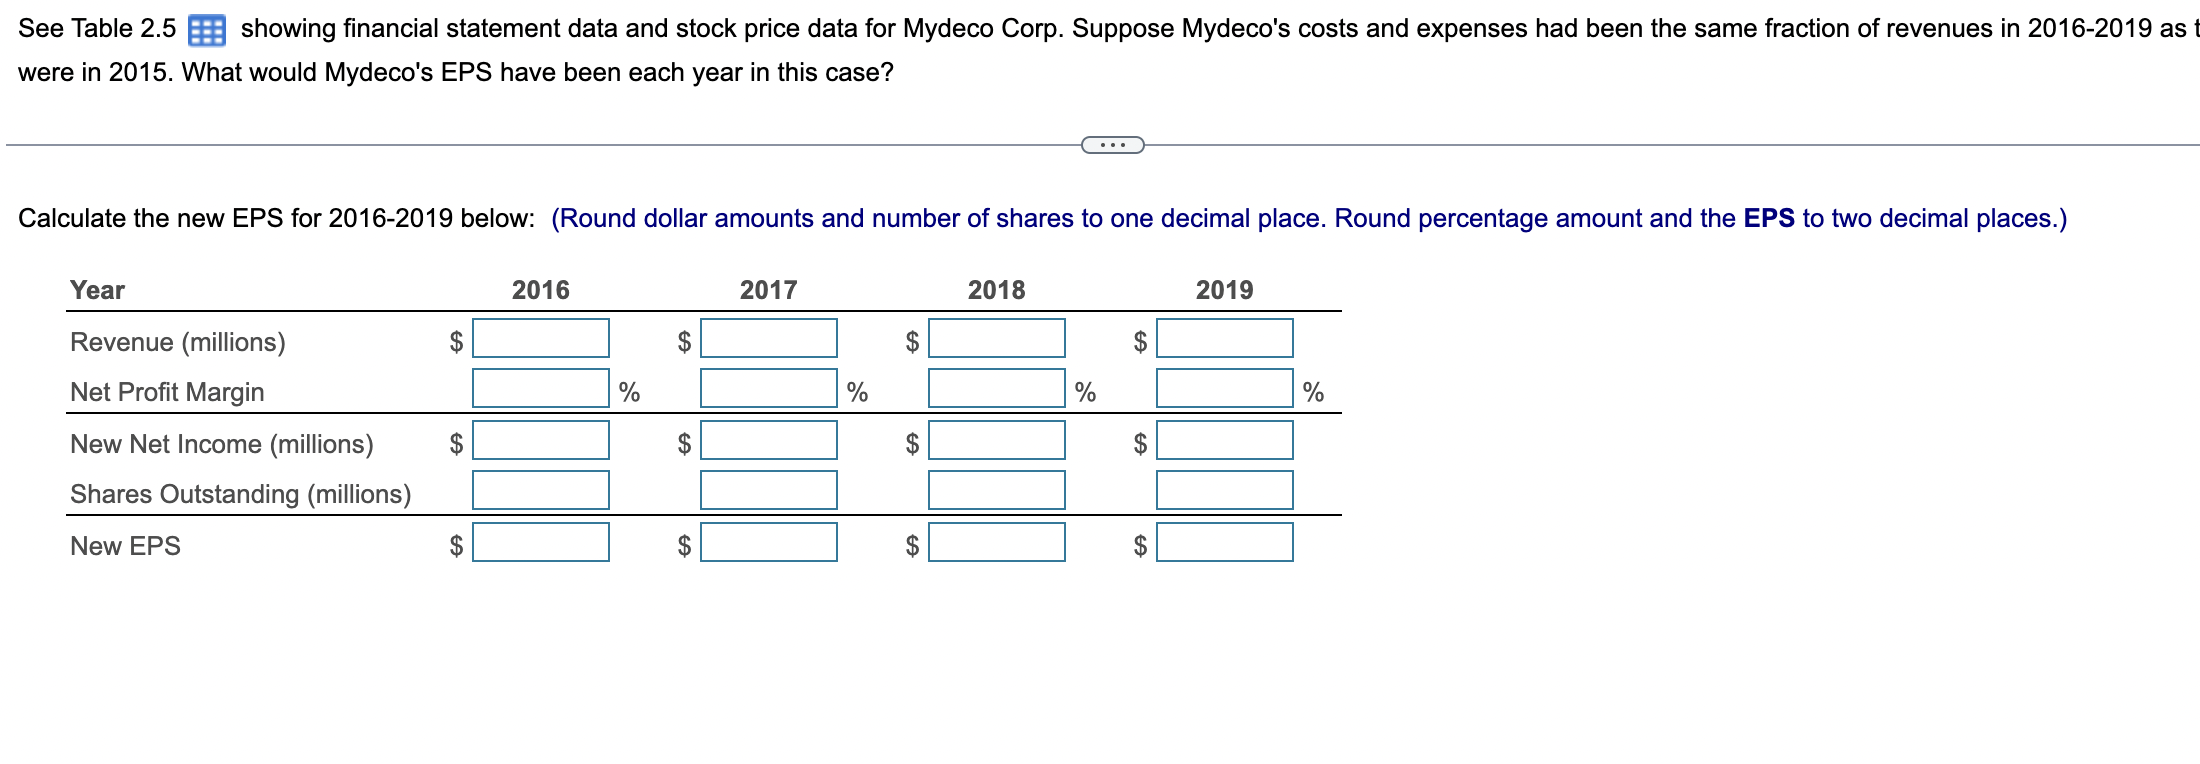
Link Copied!

Question

1 Approved Answer

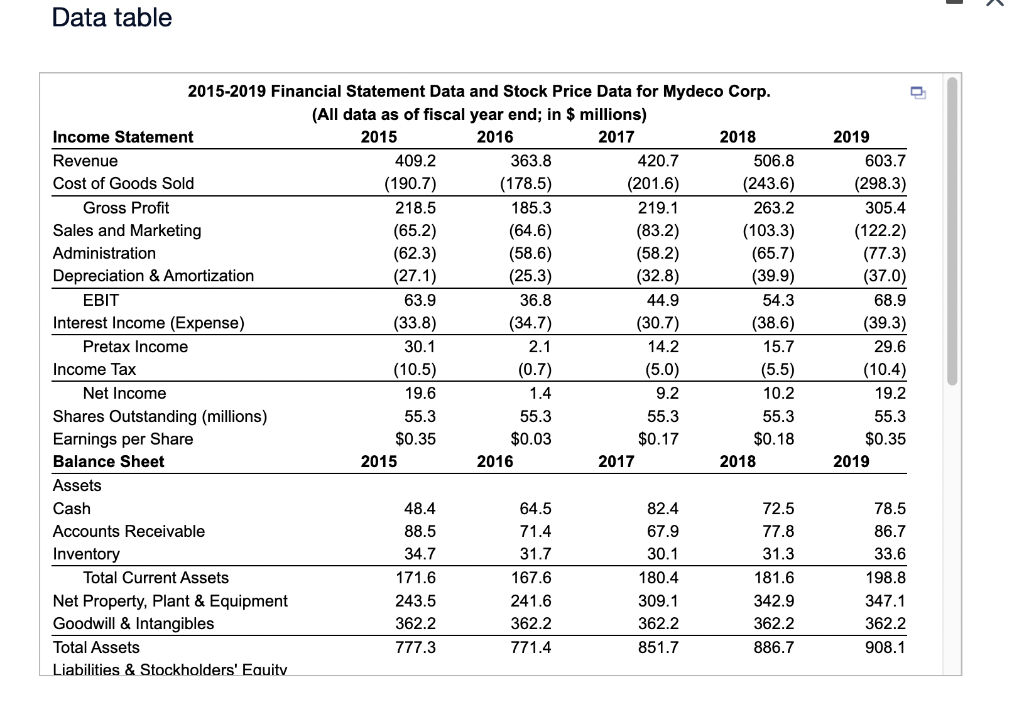
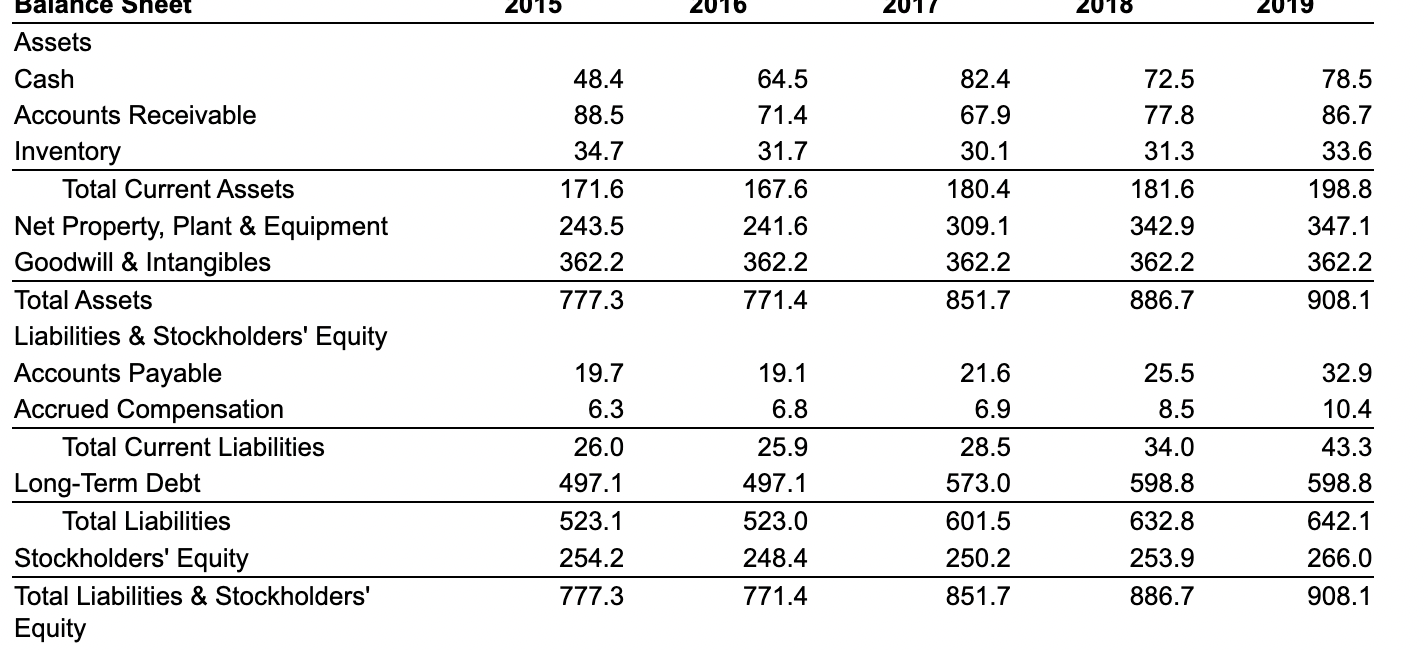
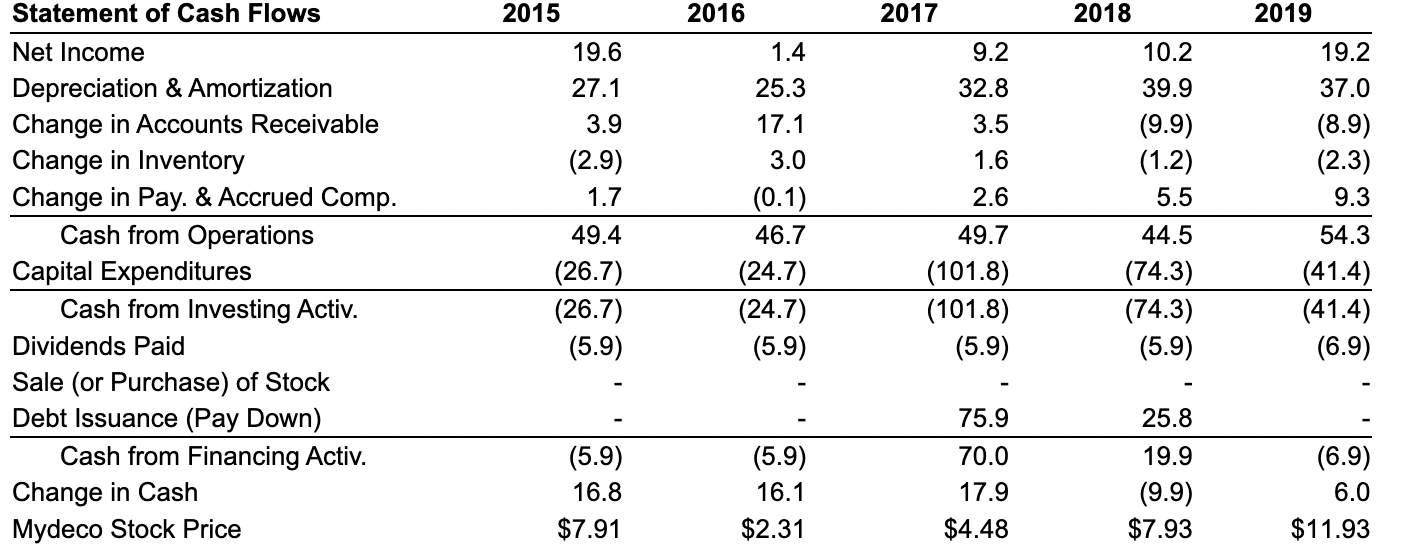
SEE ATTACHED Data table begin{tabular}{lrrrrr} Statement of Cash Flows & 2015 & 2016 & 2017 & 2019 hline Net Income & 19.6 & 1.4

image text in transcribedimage text in transcribedimage text in transcribedimage text in transcribedSEE ATTACHED

Data table \begin{tabular}{lrrrrr} Statement of Cash Flows & 2015 & 2016 & 2017 & 2019 \\ \hline Net Income & 19.6 & 1.4 & 9.2 & 10.2 & 19.2 \\ Depreciation \& Amortization & 27.1 & 25.3 & 32.8 & 39.9 & 37.0 \\ Change in Accounts Receivable & 3.9 & 17.1 & 3.5 & (9.9) & (8.9) \\ Change in Inventory & (2.9) & 3.0 & 1.6 & (1.2) & (2.3) \\ Change in Pay. \& Accrued Comp. & 1.7 & (0.1) & 2.6 & 5.5 & 9.3 \\ \hline \multicolumn{1}{c}{ Cash from Operations } & 49.4 & 46.7 & 49.7 & 44.5 & 54.3 \\ Capital Expenditures & (26.7) & (24.7) & (101.8) & (74.3) & (41.4) \\ \hline Cash from Investing Activ. & (26.7) & (24.7) & (101.8) & (74.3) & (41.4) \\ Dividends Paid & (5.9) & (5.9) & (5.9) & (5.9) & (6.9) \\ Sale (or Purchase) of Stock & & & & & \\ Debt Issuance (Pay Down) & & & 75.9 & 25.8 & \\ \hline \multicolumn{1}{c}{ Cash from Financing Activ. } & (5.9) & (5.9) & 70.0 & 19.9 & (6.9) \\ Change in Cash & 16.8 & 16.1 & $2.31 & $4.48 & $7.93 \end{tabular} See Table 2.5 showing financial statement data and stock price data for Mydeco Corp. Suppose Mydeco's costs and expenses had been the same fraction of revenues in 20162019 as vere in 2015. What would Mydeco's EPS have been each year in this case

Step by Step Solution

There are 3 Steps involved in it

Step: 1

blur-text-image

Get Instant Access to Expert-Tailored Solutions

See step-by-step solutions with expert insights and AI powered tools for academic success

Step: 2

blur-text-image

Step: 3

blur-text-image

Ace Your Homework with AI

Get the answers you need in no time with our AI-driven, step-by-step assistance

Get Started

Recommended Textbook for

More Books

Students also viewed these Finance questions