See Formulas/Defined statistical Names/Name Manager function. Wage=50 Estimated Estimated a alpha 25 Q Price=MR MC ATC Profit Labor Q MP dMPL/dQ MPL gama 0.0002 1
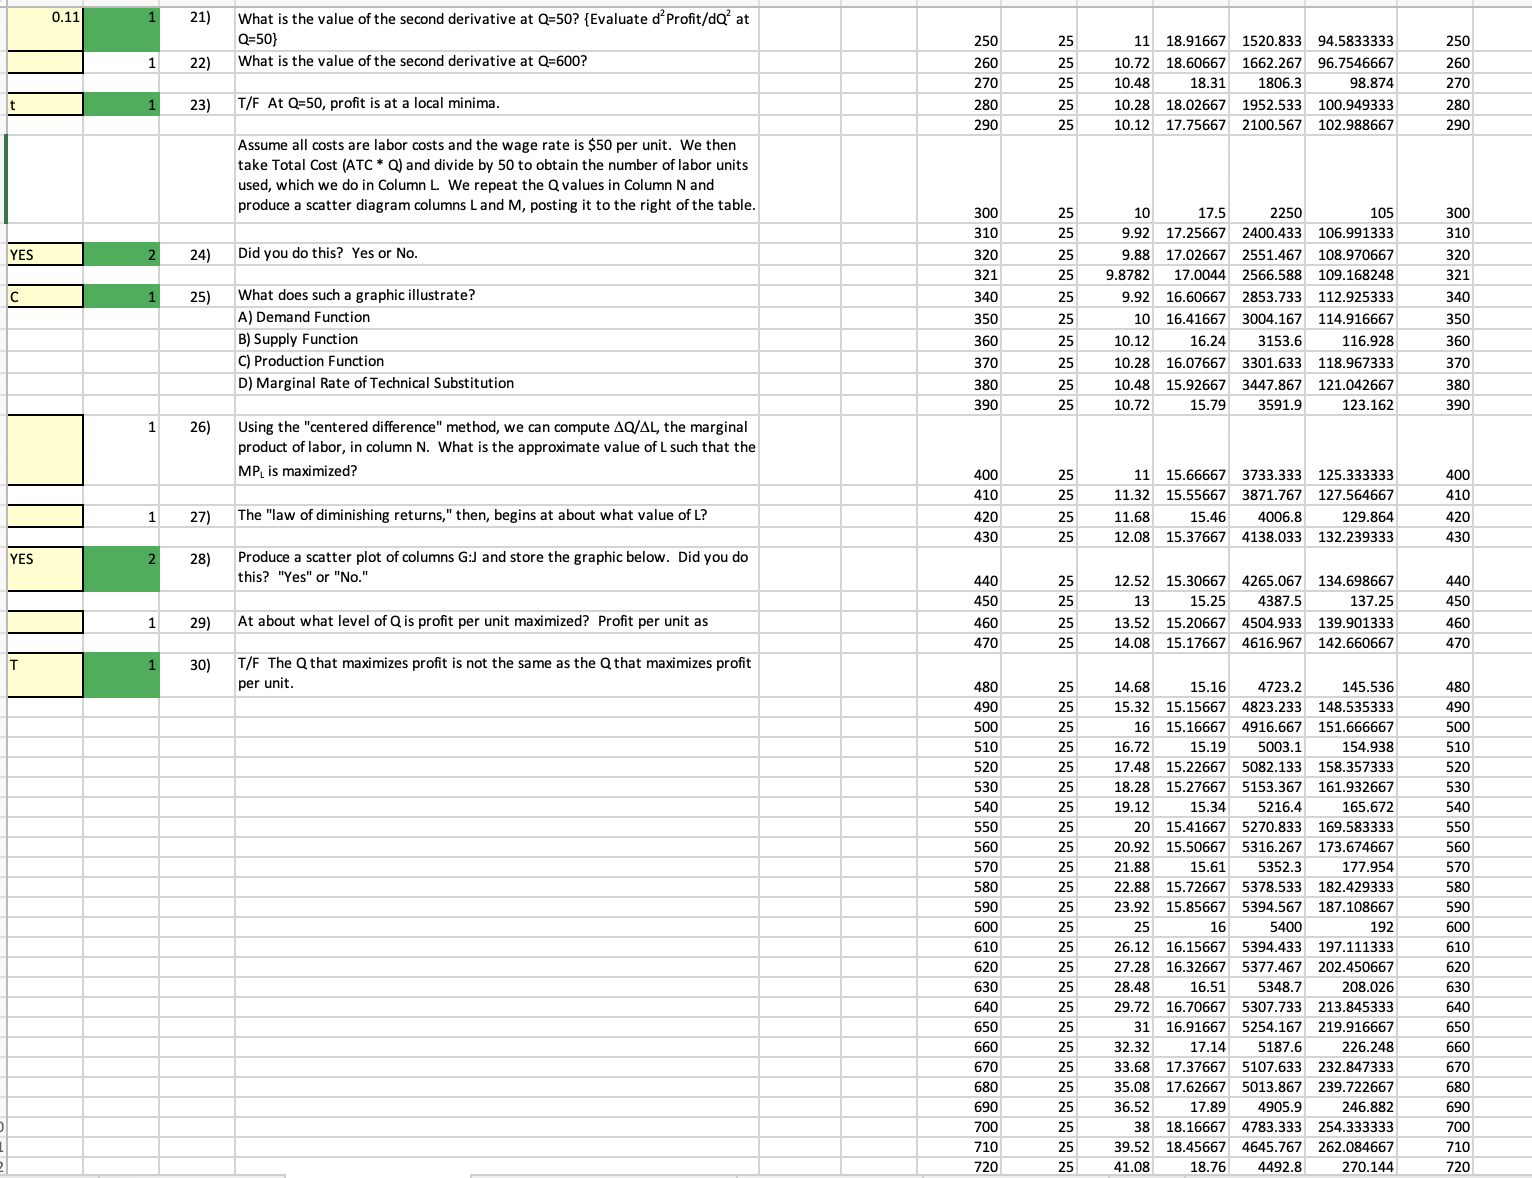
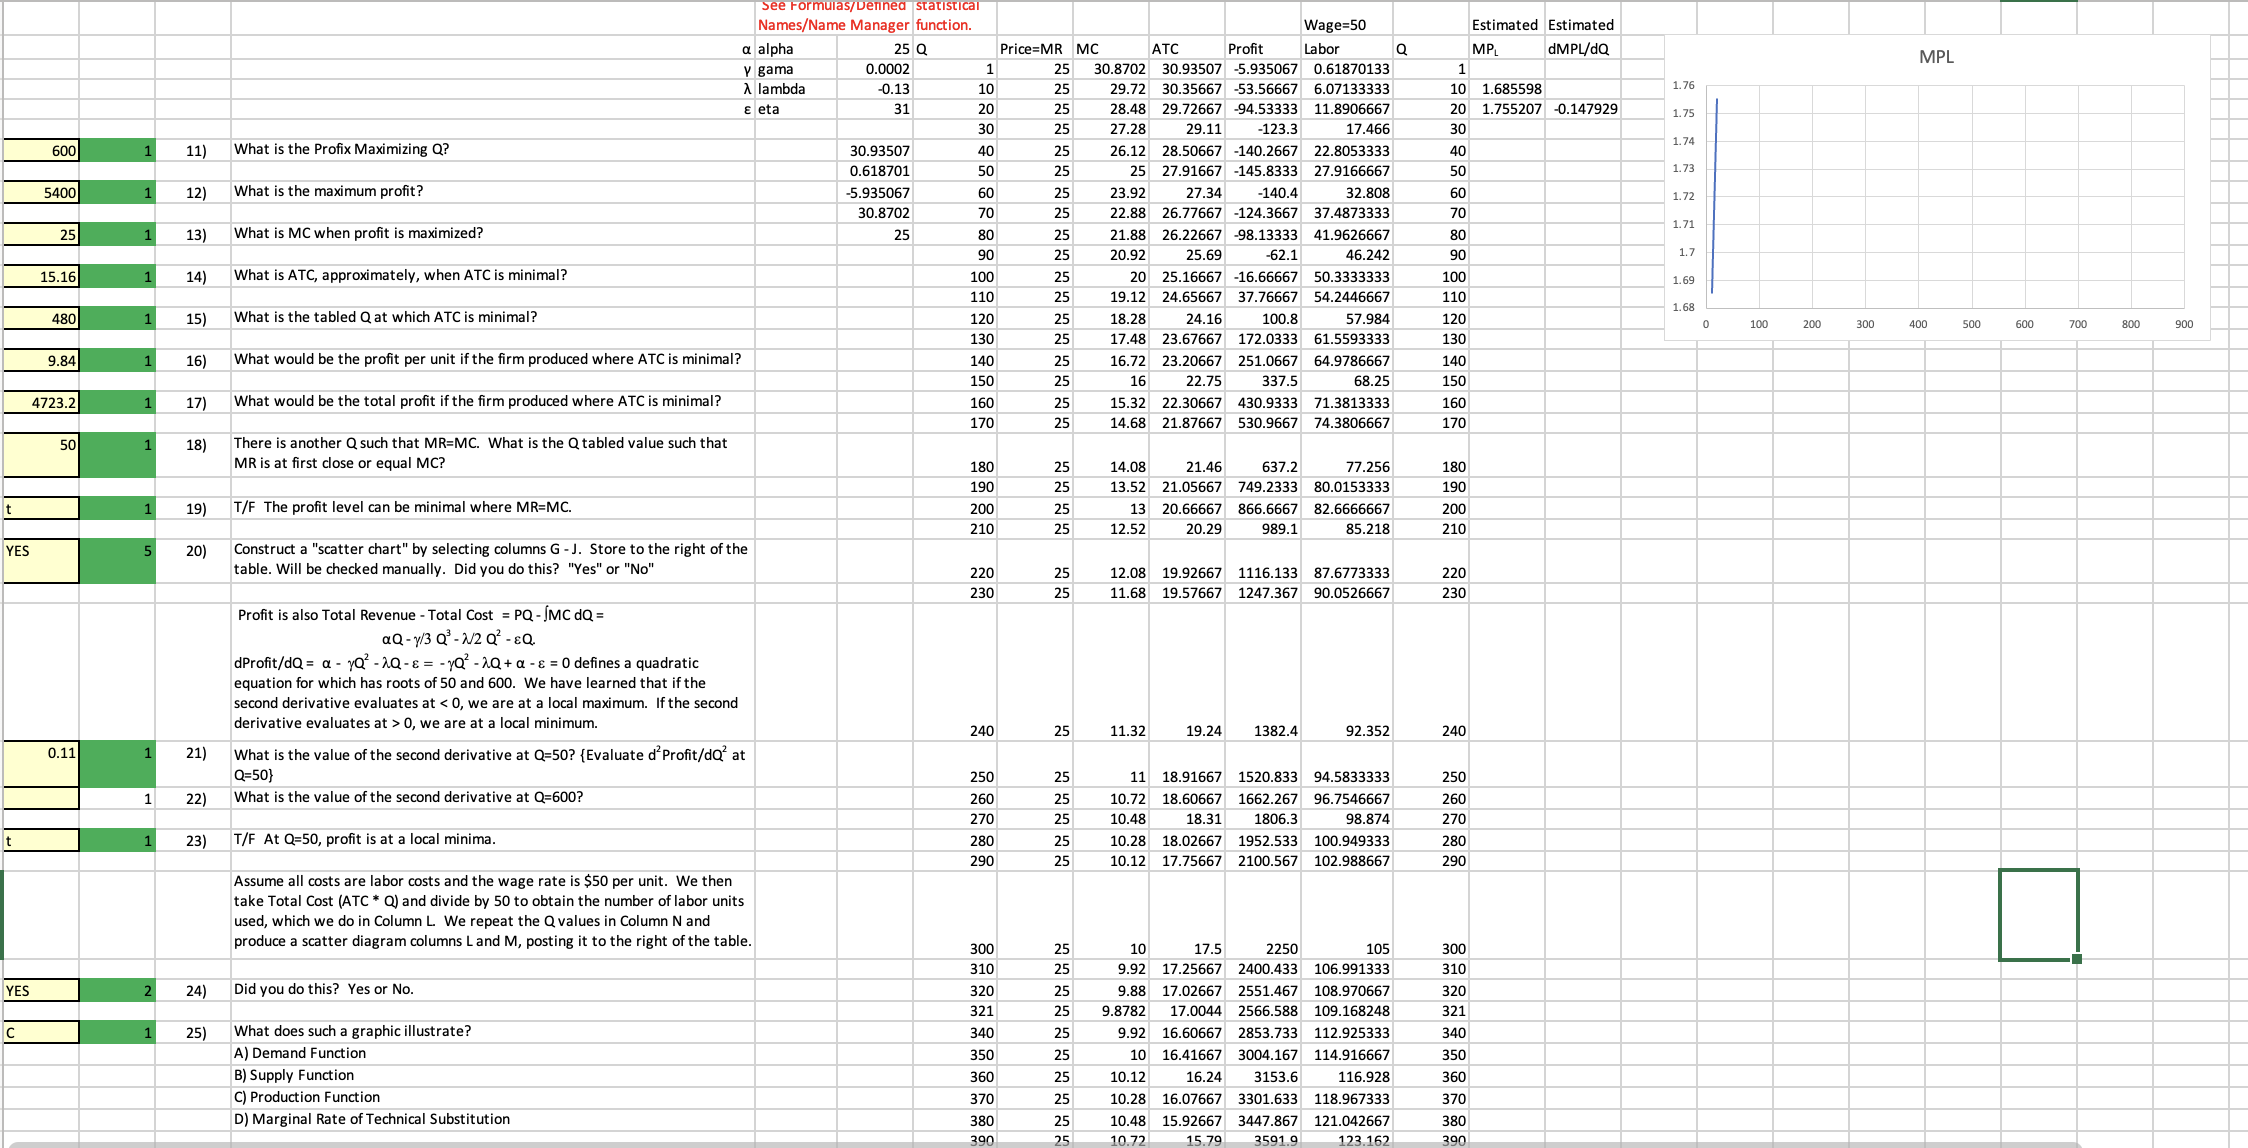
See Formulas/Defined statistical Names/Name Manager function. Wage=50 Estimated Estimated a alpha 25 Q Price=MR MC ATC Profit Labor Q MP dMPL/dQ MPL gama 0.0002 1 30.8702 30.93507 -5.935067 0.61870133 A lambda -0.13 10 25 29.72 30.35667 -53.56667 6.07133333 10 1.685598 1.76 E eta 31 20 25 28.48 29.72667 -94.53333 11.8906667 20 1.755207 -0.147929 1.75 30 25 27.28 29.11 -123.3 17.466 30 1.74 500 11) What is the Profix Maximizing Q? 30.93507 40 25 26.12 28.50667 -140.2667 22.8053333 40 0.618701 50 25 25 27.91667 -145.8333 27.9166667 50 1.73 5400 12) What is the maximum profit? -5.935067 60 25 23.92 27.34 -140.4 32.808 60 1.72 30.8702 70 25 22.88 26.77667 -124.3667 37.4873333 70 1.71 25 13) What is MC when profit is maximized? 25 80 25 21.88 26.22667 -98.13333 41.9626667 80 90 25 20.92 25.69 -62.1 46.242 90 1,7 15.16 14) What is ATC, approximately, when ATC is minimal? 100 25 20 25.16667 -16.66667 50.3333333 100 1.69 110 25 19.12 24.65667 37.76667 54.2446667 110 1.68 480 15) What is the tabled Q at which ATC is minimal? 120 18.28 24.16 100.8 57.984 120 0 100 200 300 400 500 600 700 800 900 130 17.48 23.67667 172.0333 61.5593333 130 9.84 16) What would be the profit per unit if the firm produced where ATC is minimal? 140 16.72 23.20667 251.0667 64.9786667 140 150 16 22.75 337.5 68.25 150 4723.2 17) What would be the total profit if the firm produced where ATC is minimal? 160 15.32 22.30667 430.9333 71.3813333 160 170 25 14.68 21.87667 530.9667 74.3806667 170 50 18) There is another Q such that MR=MC. What is the Q tabled value such that MR is at first close or equal MC? 180 25 14.08 21.46 637.2 77.256 180 190 25 13.52 21.05667 749.2333 80.0153333 190 19) T/F The profit level can be minimal where MR=MC. 200 25 13 20.66667 866.6667 82.6666667 200 210 25 12.52 0.29 989.1 85.218 210 YES 5 20) Construct a "scatter chart" by selecting columns G - J. Store to the right of the table. Will be checked manually. Did you do this? "Yes" or "No" 220 25 12.08 19.92667 1116.133 87.6773333 220 230 25 11.68 19.57667 1247.367 90.0526667 230 Profit is also Total Revenue - Total Cost = PQ -JMC dQ = aQ - y/3 Q' - 7/2 Q - EQ dProfit/dQ = a - yo' - 2Q -& = - yQ' - AQ + a -& = 0 defines a quadratic equation for which has roots of 50 and 600. We have learned that if the second derivative evaluates at 0, we are at a local minimum. 240 25 11.32 19.24 1382.4 92.352 240 0.11 21) What is the value of the second derivative at Q=50? {Evaluate d'Profit/do? at Q=50} 250 25 11 18.91667 1520.833 94.5833333 250 1 22) What is the value of the second derivative at Q=600? 260 25 10.72 18.60667 1662.267 96.7546667 260 270 25 10.48 18.31 1806.3 98.874 270 23) T/F At Q=50, profit is at a local minima. 280 25 10.28 18.02667 1952.533 100.949333 280 290 25 10.12 17.75667 2100.567 102.988667 290 Assume all costs are labor costs and the wage rate is $50 per unit. We then take Total Cost (ATC * Q) and divide by 50 to obtain the number of labor units used, which we do in Column L We repeat the Q values in Column N and produce a scatter diagram columns L and M, posting it to the right of the table. 300 25 10 17.5 2250 105 300 310 25 9.92 17.25667 2400.433 106.991333 310 YES 24) Did you do this? Yes or No. 320 25 9.88 17.02667 2551.467 108.970667 320 321 25 9.8782 17.0044 2566.588 109.168248 321 25) What does such a graphic illustrate? 340 25 9.92 16.60667 2853.733 112.925333 340 A) Demand Function 350 25 10 16.41667 3004.167 114.916667 350 B) Supply Function 360 25 10.12 16.24 3153.6 116.928 360 C) Production Function 370 25 10.28 16.07667 3301.633 118.967333 370 D) Marginal Rate of Technical Substitution 380 25 10.48 15.92667 3447.867 121.042667 380 390 5.79 .162 3900,11 21) What is the value of the second derivative at Q=50? {Evaluate d' Profit/dQ at 250 11 18.91667 1520.833 94.5833333 250 Q=50} 25 260 25 10.72 18.60667 1662.267 96.7546667 260 1 22) What is the value of the second derivative at Q=600? 270 10.48 18.31 1806.3 98.874 270 10.28 18.02667 1952.533 100.949333 23 ) T/F At Q=50, profit is at a local minima. 280 25 280 290 25 10.12 17.75667 2100.567 102.988667 290 Assume all costs are labor costs and the wage rate is $50 per unit. We then take Total Cost (ATC * Q) and divide by 50 to obtain the number of labor units used, which we do in Column L. We repeat the Q values in Column N and produce a scatter diagram columns L and M, posting it to the right of the table. 300 25 10 17.5 2250 105 300 310 25 9.92 17.25667 2400.433 106.991333 310 320 25 9.88 17.02667 2551.467 108.970667 320 YES 24) Did you do this? Yes or No. 321 25 9.8782 17.0044 2566.588 109.168248 321 What does such a graphic illustrate? 340 25 9.92 16.60667 2853.733 112.925333 340 25) 10 16.41667 3004.167 114.916667 350 A) Demand Function 350 25 360 25 10.12 16.24 3153.6 116.928 360 B) Supply Function C) Production Function 370 25 10.28 16.07667 3301.633 118.967333 370 D) Marginal Rate of Technical Substitution 380 25 10.48 15.92667 3447.867 121.042667 380 390 25 10.72 15.79 3591.9 123.162 390 1 26) Using the "centered difference" method, we can compute AQ/AL, the marginal product of labor, in column N. What is the approximate value of L such that the 400 25 11 15.66667 3733.333 125.333333 400 MPL is maximized? 410 25 11.32 15.55667 3871.767 127.564667 410 The "law of diminishing returns," then, begins at about what value of L? 420 25 11.68 15.46 4006.8 129.864 420 1 27) 430 25 12.08 15.37667 4138.033 132.239333 430 YES 28) Produce a scatter plot of columns G:J and store the graphic below. Did you do this? "Yes" or "No." 440 25 12.52 15.30667 4265.067 134.698667 440 450 25 13 15.25 4387.5 137.25 450 At about what level of Q is profit per unit maximized? Profit per unit as 460 25 13.52 15.20667 4504.933 139.901333 460 29) 470 25 14.08 15.17667 4616.967 142.660667 470 30) T/F The Q that maximizes profit is not the same as the Q that maximizes profit 14.68 15.16 4723.2 145.536 480 per unit. 480 25 490 25 15.32 15.15667 4823.233 148.535333 490 500 25 16 15.16667 4916.667 151.666667 50 510 25 16.72 15.19 5003.1 154.93 510 520 25 17.48 15.22667 5082.133 158.357333 520 530 25 18.28 15.27667 5153.367 161.932667 530 540 25 19.12 15.34 5216.4 165.672 540 550 25 20 15.41667 5270.833 169.583333 550 560 25 20.92 15.50667 5316.267 173.674667 560 570 25 21.8 15.61 5352.3 177.954 570 580 25 22.88 15.72667 5378.533 182.42933 580 590 25 23.92 15.85667 5394.567 187.108667 590 600 25 25 16 5400 192 600 610 25 26.12 16.15667 5394.433 197.111333 610 620 27.28 16.32667 5377.467 202.450667 620 630 25 28.48 16.51 5348.7 208.026 630 640 25 29.72 16.70667 5307.733 213.845333 640 650 25 31 16.91667 5254.167 219.916667 650 660 25 32.32 17.14 5187.6 226.248 660 670 33.68 17.37667 5107.633 232.84733 670 680 35.08 17.62667 5013.867 239.722667 680 590 36.52 17.89 4905.9 246.882 690 00 38 18.16667 4783.333 2 254.333333 700 710 39.52 18.45667 4645.767 262.084667 710 720 25 41.08 18.76 4492.8 270.144 720
Step by Step Solution
There are 3 Steps involved in it
Step: 1
Get Instant Access to Expert-Tailored Solutions
See step-by-step solutions with expert insights and AI powered tools for academic success
Step: 2
Step: 3
Ace Your Homework with AI
Get the answers you need in no time with our AI-driven, step-by-step assistance