

Answered step by step
Verified Expert Solution
Question
1 Approved Answer
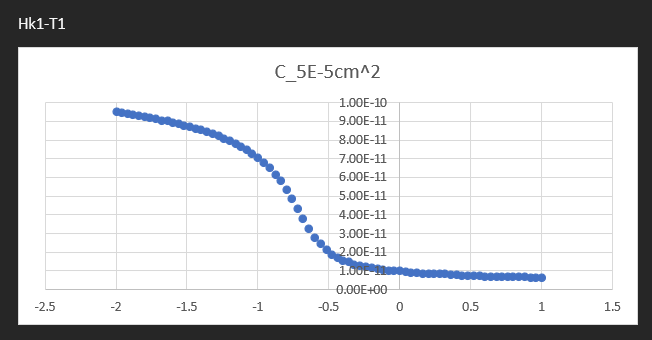
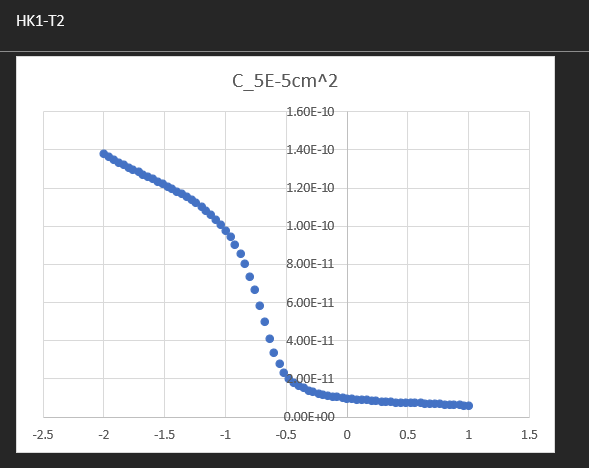
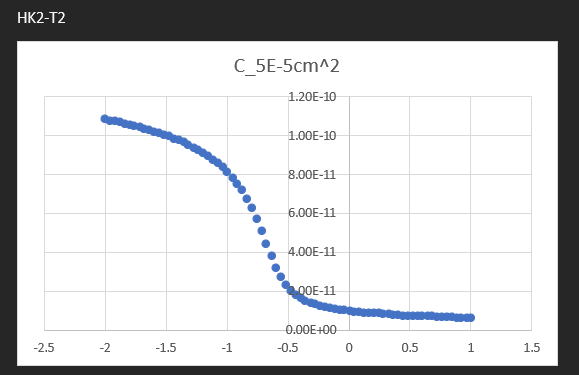
See plotted Hk1-T1,Hk1-T2,Hk2-T1,Hk2-T2 You received experimental data ( 2 Excel files) with very little detail, except the following: - Each Excel file is from a
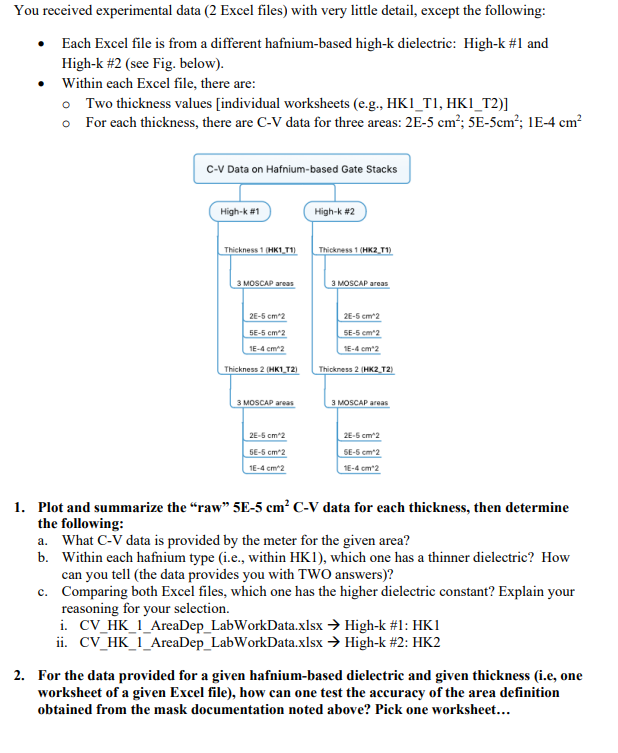
See plotted Hk1-T1,Hk1-T2,Hk2-T1,Hk2-T2
Step by Step Solution
There are 3 Steps involved in it
Step: 1

Get Instant Access to Expert-Tailored Solutions
See step-by-step solutions with expert insights and AI powered tools for academic success
Step: 2

Step: 3
Ace Your Homework with AI
Get the answers you need in no time with our AI-driven, step-by-step assistance
Get Started
Introduction To Managerial Accounting
Authors: Peter C. Brewer
Custom Edition
0077842987, 978-0077842987