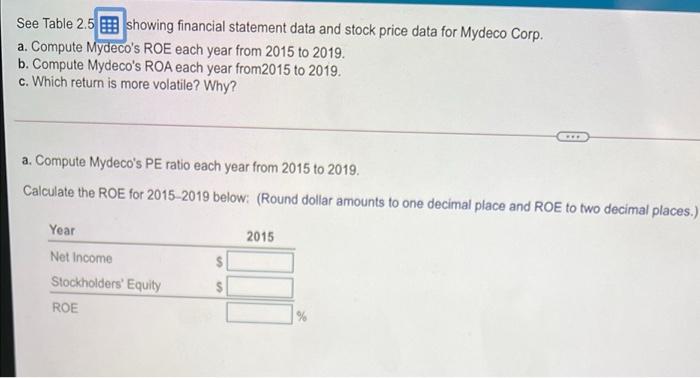
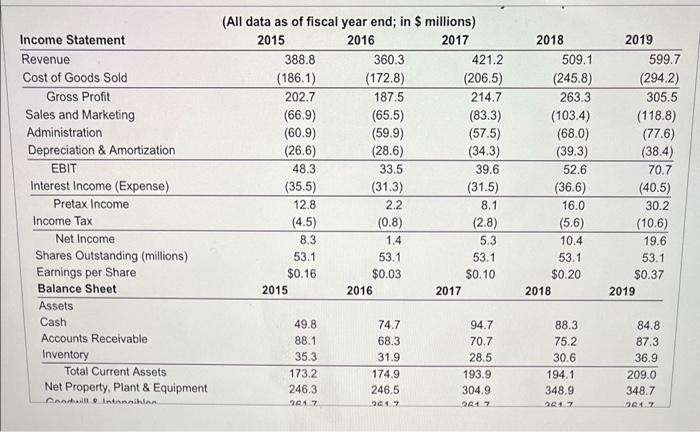
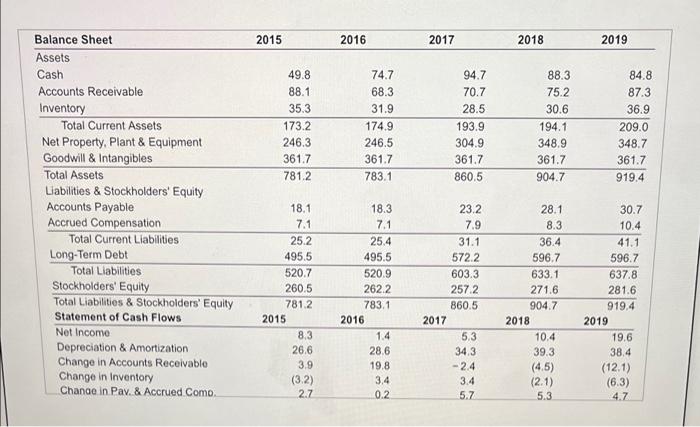
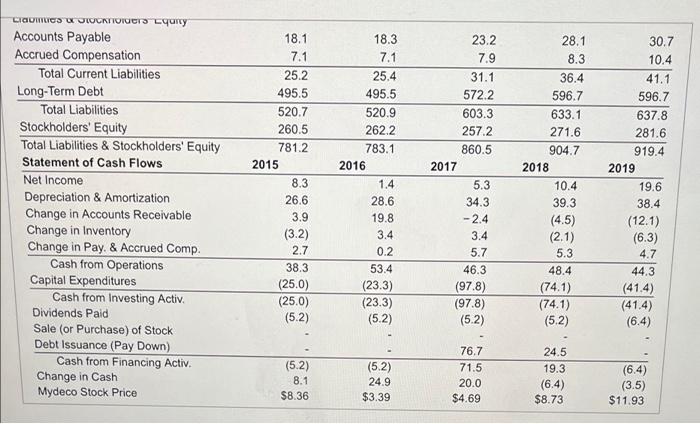
See Table 2.5 E showing financial statement data and stock price data for Mydeco Corp. a. Compute Mydeco's ROE each year from 2015 to 2019. b. Compute Mydeco's ROA each year from 2015 to 2019. c. Which return is more volatile? Why? a. Compute Mydeco's PE ratio each year from 2015 to 2019. Calculate the ROE for 2015-2019 below(Round dollar amounts to one decimal place and ROE to two decimal places.) Year 2015 Net Income Stockholders' Equity ROE $ % Income Statement Revenue Cost of Goods Sold Gross Profit Sales and Marketing Administration Depreciation & Amortization EBIT Interest Income (Expense) Pretax Income Income Tax Net Income Shares Outstanding (millions) Earnings per Share Balance Sheet Assets Cash Accounts Receivable Inventory Total Current Assets Net Property, Plant & Equipment (All data as of fiscal year end; in $ millions) 2015 2016 2017 388.8 360.3 421.2 (186.1) (172.8) (206.5) 202.7 187.5 214.7 (66.9) (65.5) (83.3) (60.9) (59.9) (57.5) (26.6) (28.6) (34.3) 48.3 33.5 39.6 (35.5) (31.3) (31.5) 12.8 2.2 8.1 (4.5) (0.8) (2.8) 8.3 1.4 5.3 53.1 53.1 53.1 $0.16 $0.03 $0.10 2015 2016 2017 2018 509.1 (245.8) 263.3 (103.4) (68.0) (39.3) 52.6 (36.6) 16.0 (5.6) 10.4 53.1 $0.20 2018 2019 599.7 (294.2) 305.5 (118.8) (77.6) (38.4) 70.7 (40.5) 30.2 (10.6) 19.6 53.1 $0.37 2019 49.8 88.1 35.3 173.2 246.3 2017 74.7 68.3 31.9 174.9 246.5 2017 94.7 70.7 28.5 193.9 304.9 2007 88.3 75.2 30.6 194.1 348.9 2017 84.8 87.3 36.9 209.0 348.7 264.2 Cintamnika 2015 2016 2017 2018 2019 49.8 88.1 35.3 173.2 246.3 361.7 781.2 74.7 68.3 31.9 174.9 246.5 361.7 783.1 94.7 70.7 28.5 193.9 304.9 361.7 860.5 88.3 75.2 30.6 194.1 348.9 361.7 904.7 84.8 87.3 36.9 209.0 348.7 361.7 919.4 18.3 Balance Sheet Assets Cash Accounts Receivable Inventory Total Current Assets Net Property, Plant & Equipment Goodwill & Intangibles Total Assets Liabilities & Stockholders' Equity Accounts Payable Accrued Compensation Total Current Liabilities Long-Term Debt Total Liabilities Stockholders' Equity Total Liabilities & Stockholders' Equity Statement of Cash Flows Net Income Depreciation & Amortization Change in Accounts Receivable Change in Inventory Change in Pay & Accrued Como 7.1 18.1 7.1 25.2 495.5 520.7 260.5 781.2 2015 8.3 26.6 3.9 (3.2) 2.7 25.4 495.5 520.9 262.2 783.1 2016 1.4 28.6 19.8 3,4 0.2 23.2 7.9 31.1 5722 603.3 2572 860.5 2017 5.3 34.3 -2.4 3.4 5.7 28.1 8.3 36.4 596.7 633.1 271.6 904.7 2018 10.4 39.3 (4.5) (2.1) 5.3 30.7 10.4 41.1 596.7 637.8 281.6 919.4 2019 19.6 38.4 (12.1) (6.3) 4.7 COMUS JITIOIDES Lyony Accounts Payable Accrued Compensation Total Current Liabilities Long-Term Debt Total Liabilities Stockholders' Equity Total Liabilities & Stockholders' Equity Statement of Cash Flows Net Income Depreciation & Amortization Change in Accounts Receivable Change in Inventory Change in Pay. & Accrued Comp. Cash from Operations Capital Expenditures Cash from Investing Activ. Dividends Paid Sale (or Purchase) of Stock Debt Issuance (Pay Down) Cash from Financing Activ. Change in Cash Mydeco Stock Price 18.1 7.1 25.2 495.5 520.7 260.5 781.2 2015 8.3 26.6 3.9 (3.2) 2.7 38.3 (25.0) (25.0) (5.2) 18.3 7.1 25.4 495.5 520.9 262.2 783.1 2016 1.4 28.6 19.8 3.4 0.2 53.4 (23.3) (23.3) (5.2) 23.2 7.9 31.1 572.2 603.3 257.2 860.5 2017 5.3 34.3 -2.4 3.4 5.7 46.3 (97.8) (97.8) (5.2) 28.1 8.3 36.4 596.7 633.1 271.6 904.7 2018 10.4 39.3 (4.5) (2.1) 5.3 48.4 (74.1) (74.1) (5.2) 30.7 10.4 41.1 596.7 637.8 281.6 919.4 2019 19.6 38.4 (12.1) (6.3) 4.7 44.3 (41.4) (41.4) (6.4) (5.2) 8.1 $8.36 (5.2) 24.9 $3.39 76.7 71.5 20.0 $4.69 24.5 19.3 (6.4) $8.73 (6.4) (3.5) $11.93