
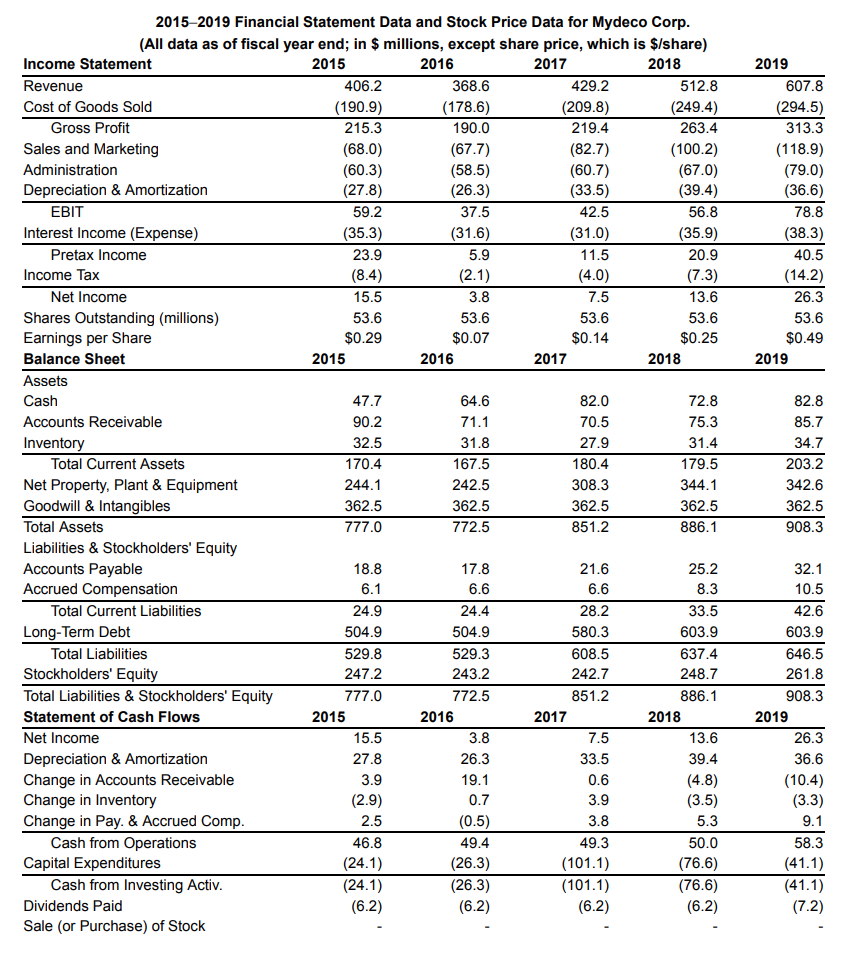
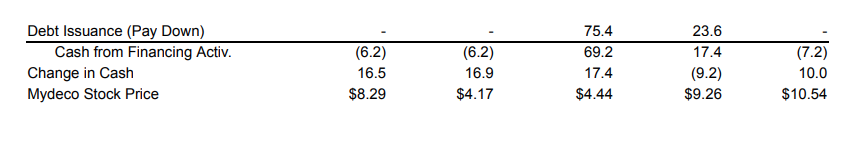
See Table 2.5 E showing financial statement data and stock price data for Mydeco Corp. a. From 2015 to 2019, what was the total cash flow that Mydeco generated from operations? b. What fraction of the total in (a) was spent on capital expenditures? c. What fraction of the total in (a) was spent paying dividends to shareholders? d. What was Mydeco's total retained earnings for this period? 2019 607.8 (294.5) 313.3 (118.9) (79.0) (36.6) 78.8 (38.3) 40.5 (14.2) 26.3 53.6 $0.49 2019 (31.0) 2015-2019 Financial Statement Data and Stock Price Data for Mydeco Corp. (All data as of fiscal year end; in $ millions, except share price, which is $/share) Income Statement 2015 2016 2017 2018 Revenue 406.2 368.6 429.2 512.8 Cost of Goods Sold (190.9) (178.6) (209.8) (249.4) Gross Profit 215.3 190.0 219.4 263.4 Sales and Marketing (68.0) (67.7) (82.7) (100.2) Administration (60.3) (58.5) (60.7) (67.0) Depreciation & Amortization (27.8) (26.3) (33.5) (39.4) EBIT 59.2 37.5 42.5 56.8 Interest Income (Expense) (35.3) (31.6) (35.9) Pretax Income 23.9 5.9 11.5 20.9 Income Tax (8.4) (2.1) (4.0) (7.3) Net Income 15.5 3.8 7.5 13.6 Shares Outstanding (millions) 53.6 53.6 53.6 53.6 Earnings per Share $0.29 $0.07 $0.14 $0.25 Balance Sheet 2015 2016 2017 2018 Assets Cash 47.7 64.6 82.0 72.8 Accounts Receivable 90.2 71.1 70.5 75.3 Inventory 32.5 31.8 27.9 31.4 Total Current Assets 170.4 167.5 180.4 179.5 Net Property, Plant & Equipment 244.1 242.5 308.3 344.1 Goodwill & Intangibles 362.5 362.5 362.5 362.5 Total Assets 777.0 772.5 851.2 886.1 Liabilities & Stockholders' Equity Accounts Payable 18.8 17.8 21.6 25.2 Accrued Compensation 6.1 6.6 6.6 8.3 Total Current Liabilities 24.9 24.4 28.2 33.5 Long-Term Debt 504.9 504.9 580.3 603.9 Total Liabilities 529.8 529.3 608.5 637.4 Stockholders' Equity 247.2 243.2 242.7 248.7 Total Liabilities & Stockholders' Equity 777.0 772.5 851.2 886.1 Statement of Cash Flows 2015 2016 2017 2018 Net Income 15.5 3.8 7.5 13.6 Depreciation & Amortization 27.8 26.3 33.5 39.4 Change in Accounts Receivable 3.9 19.1 0.6 (4.8) Change in Inventory (2.9) 0.7 3.9 (3.5) Change in Pay. & Accrued Comp. 2.5 (0.5) 3.8 5.3 Cash from Operations 46.8 49.4 49.3 50.0 Capital Expenditures (24.1) (26.3) (101.1) (76.6) Cash from Investing Activ. (24.1) (26.3) (101.1) (76.6) Dividends Paid (6.2) (6.2) (6.2) (6.2) Sale (or Purchase) of Stock 82.8 85.7 34.7 203.2 342.6 362.5 908.3 32.1 10.5 42.6 603.9 646.5 261.8 908.3 2019 26.3 36.6 (10.4) (3.3) 9.1 58.3 (41.1) (41.1) (7.2) Debt Issuance (Pay Down) Cash from Financing Activ. Change in Cash Mydeco Stock Price (6.2) 16.5 $8.29 (6.2) 16.9 $4.17 75.4 69.2 17.4 $4.44 23.6 17.4 (9.2) $9.26 (7.2) 10.0 $10.54