

Question
See table 2.5 showing financial statement data and stock price data for Mydeco Corp. a) What percentage did Mydeco's revenues grow each year from 2015
See table 2.5 showing financial statement data and stock price data for Mydeco Corp. a) What percentage did Mydeco's revenues grow each year from 2015 to 2018? b) By what percentage did net income grow each year? c) Why might the growth rates of revenues and net income differ ?
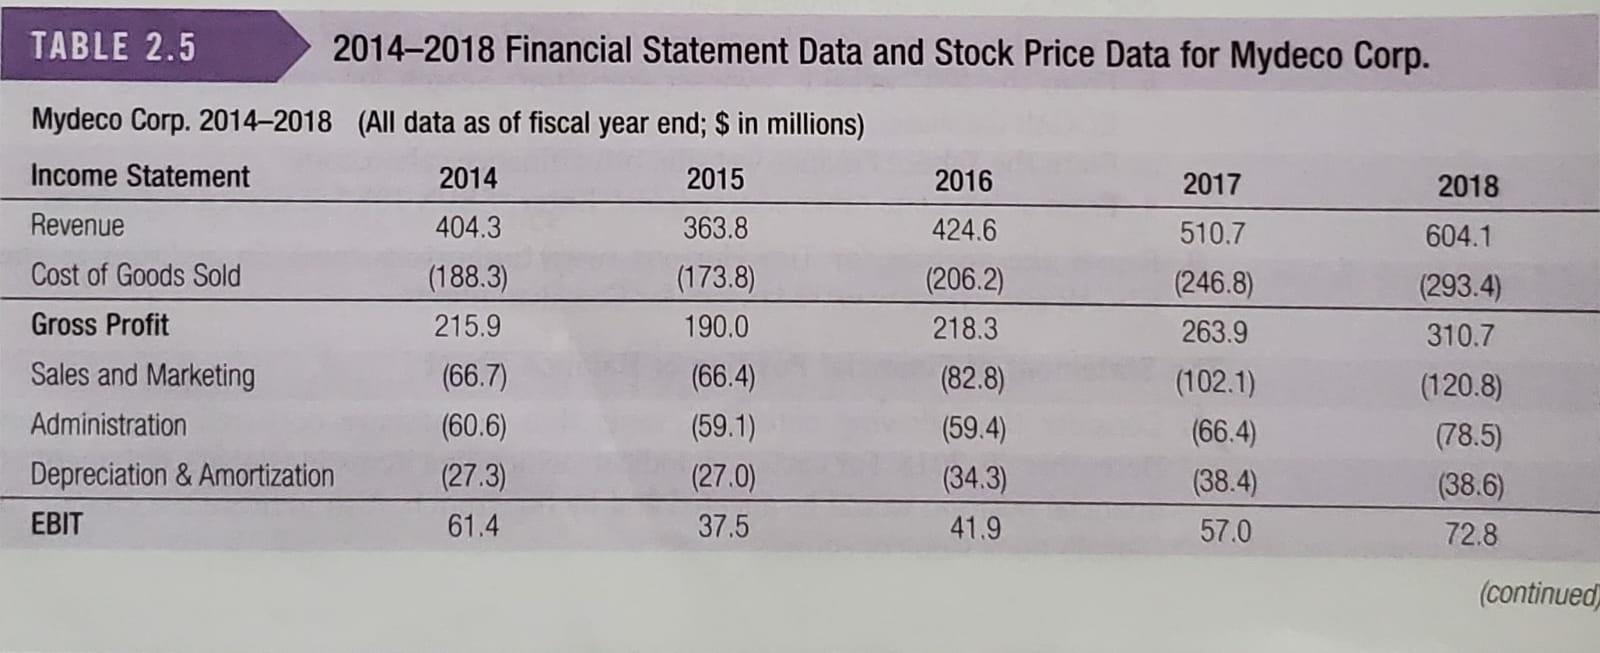
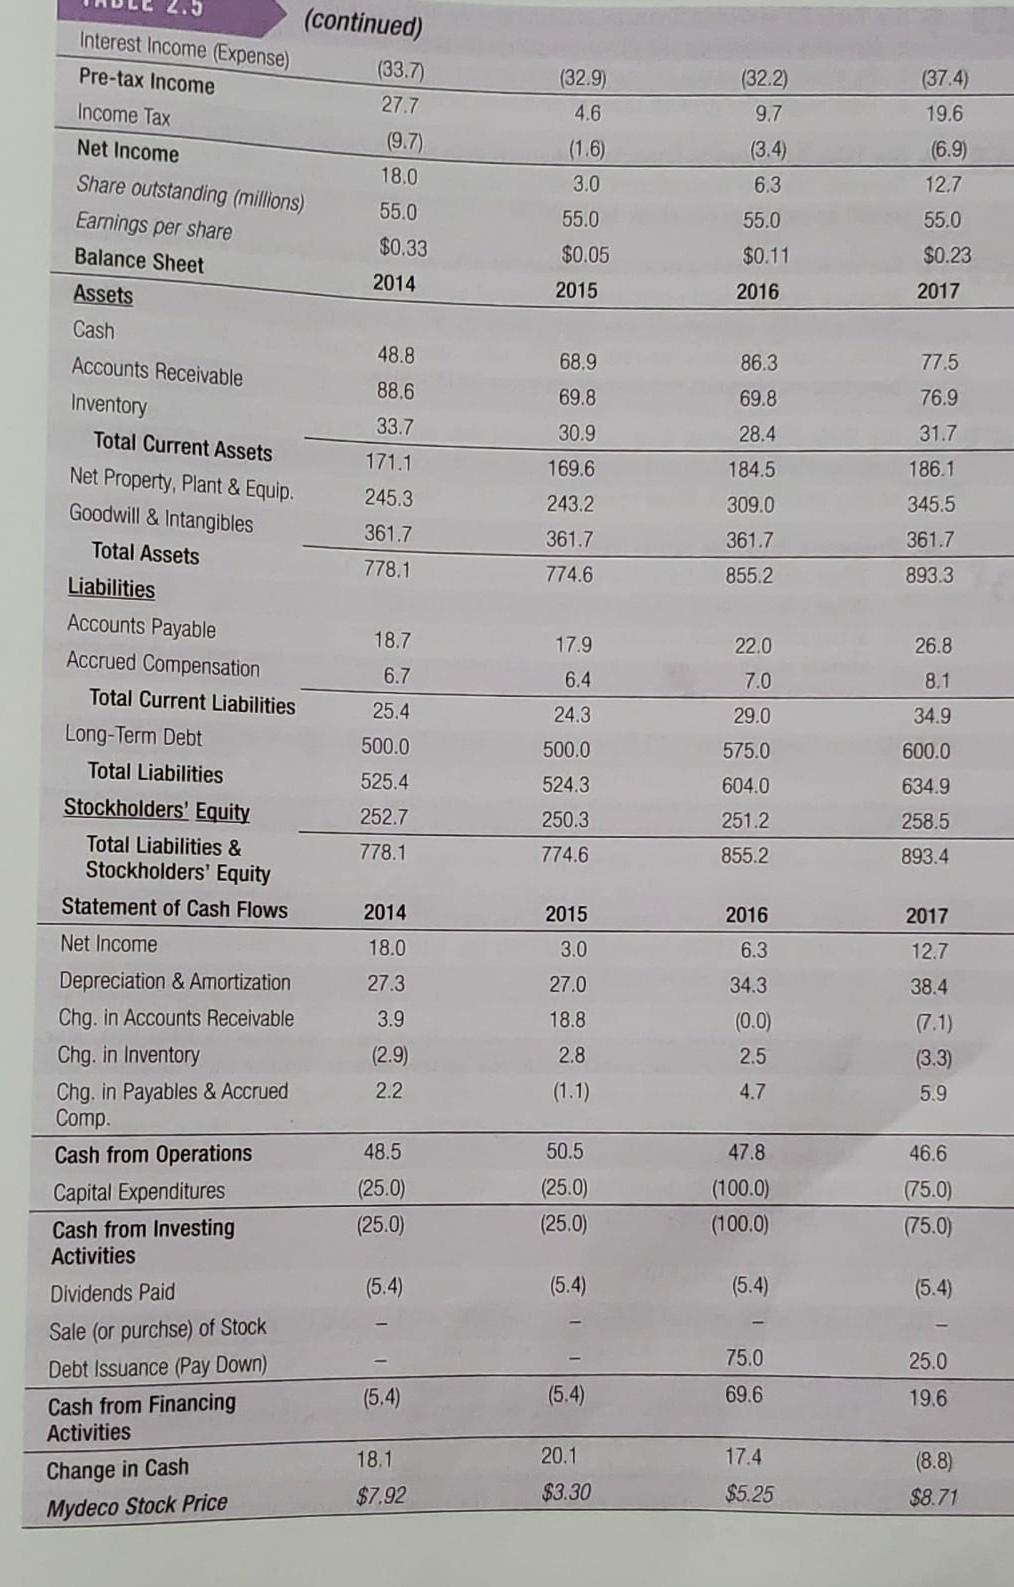
TABLE 2.5 2014-2018 Financial Statement Data and Stock Price Data for Mydeco Corp. 2016 2018 424.6 604.1 (293.4) Mydeco Corp. 20142018 (All data as of fiscal year end; $ in millions) Income Statement 2014 2015 Revenue 404.3 363.8 Cost of Goods Sold (188.3) (173.8) Gross Profit 215.9 190.0 Sales and Marketing (66.7) (66.4) Administration (60.6) (59.1) Depreciation & Amortization (27.3) (27.0) EBIT 61.4 37.5 310.7 (206.2) 218.3 (82.8) (59.4) (34.3) 41.9 2017 510.7 (246.8) 263.9 (102.1) (66.4) (38.4) 57.0 (120.8) (78.5) (38.6) 72.8 (continued (32.9 4.6 (1.6) 3.0 (32.2) 9.7 (3.4 6.3 55.0 $0.11 (37.4) 19.6 (6.9 12.7 55.0 55.0 $0.05 $0.23 2015 2016 2017 86.3 77.5 68.9 69.8 69.8 28.4 76.9 31.7 186.1 30.9 169.6 243.2 184.5 (continued) Interest Income (Expense) (33.7) Pre-tax Income 27.7 Income Tax (9.7) Net Income 18.0 Share outstanding (millions) 55.0 Earnings per share $0.33 Balance Sheet 2014 Assets Cash 48.8 Accounts Receivable 88.6 Inventory 33.7 Total Current Assets 171 Net Property, Plant & Equip. 245.3 Goodwill & Intangibles 361.7 Total Assets 778.1 Liabilities Accounts Payable 18.7 Accrued Compensation 6.7 Total Current Liabilities 25.4 Long-Term Debt 500.0 Total Liabilities 525.4 Stockholders' Equity 252.7 Total Liabilities & 778.1 Stockholders' Equity Statement of Cash Flows 2014 Net Income 18.0 27.3 309.0 345.5 361.7 361.7 361.7 774.6 855.2 893.3 17.9 26.8 22.0 7.0 6.4 8.1 24.3 34.9 29.0 575.0 500.0 600.0 604.0 524.3 250.3 634.9 258.5 251.2 774.6 855.2 893.4 2015 2016 2017 3.0 6.3 12.7 38.4 27.0 18.8 3.9 34.3 (0.0 2.5 (7.1) (3.3) 2.8 (2.9 2.2 (1.1) 4.7 5.9 48.5 50.5 47.8 46.6 (75.0 (25.0) (25.0 (25.0) (25.0) (100.0 (100.0) (75.) Depreciation & Amortization Chg. in Accounts Receivable Chg. in Inventory Chg. in Payables & Accrued Comp. . Cash from Operations Capital Expenditures Cash from Investing Activities Dividends Paid Sale (or purchse) of Stock Debt Issuance (Pay Down) Cash from Financing Activities Change in Cash Mydeco Stock Price (5.4) (5.4) (5.4) (5.4) 75.0 25.0 (5.4) (5.4) 69.6 19.6 18.1 20.1 17.4 (8.8) $8.71 $7.92 $3.30 $5.25
Step by Step Solution
There are 3 Steps involved in it
Step: 1

Get Instant Access to Expert-Tailored Solutions
See step-by-step solutions with expert insights and AI powered tools for academic success
Step: 2

Step: 3
Ace Your Homework with AI
Get the answers you need in no time with our AI-driven, step-by-step assistance
Get Started
Audit To Love
Authors: Jezabel Lima
1st Edition
B0C2SG8JS7, 979-8988078807