See Table 2.5 showing financial statement data and stock price data for Mydeco Corp.
a. By what percentage did Mydeco's revenues grow each year from
2013 to 2016?
b. By what percentage did net income grow each year?
c. Why might the growth rates of revenues and net income differ?
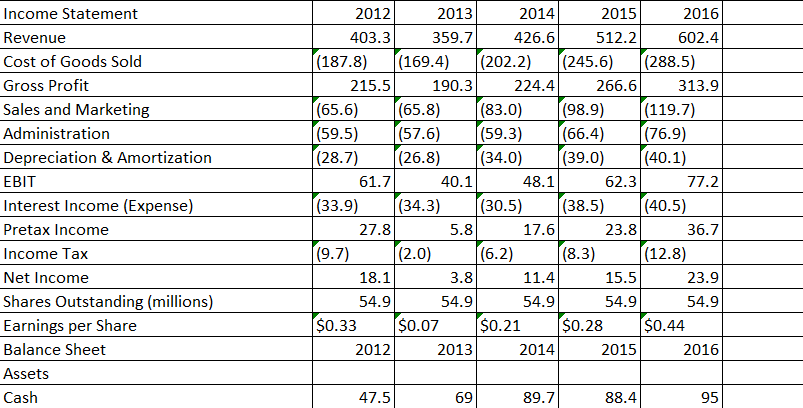
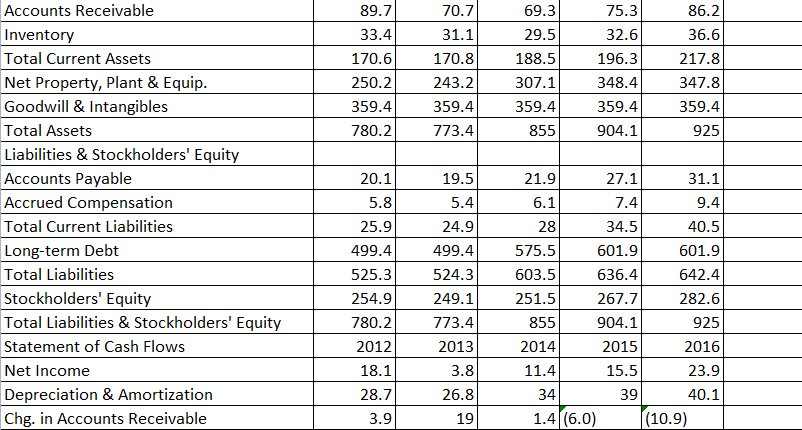
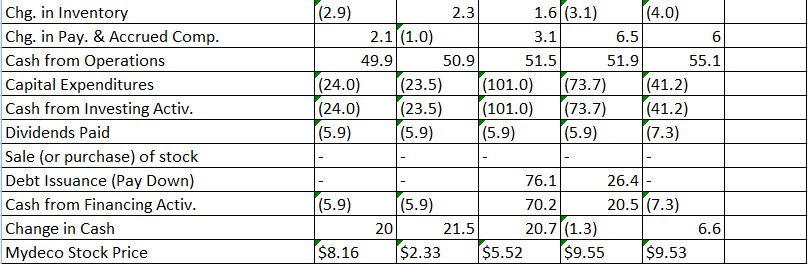
Income Statement Revenue Cost of Goods Sold Gross Profit Sales and Marketing Administration Depreciation & Amortization EBIT Interest Income (Expense) Pretax Income Income Tax Net Income Shares Outstanding (millions) Earnings per Share Balance Sheet Assets Cash 2012 2013 2014 2015 2016 403. 3 359.7 426.6 512. 2 602.4 (187.8) (169.4) f(202.2) (245.6) (288.5) 215.5 190. 3 2 24.4 266.6 313.9 (65.6) (65.8) (83.0) (98.9) (119.7) (59.5) (57.6) (59.3) (66.4) (76.9) (28.7) (26.8) (34.0) (39.0) (40.1) 61.7 40. 1 4 8.1 62.3 77.2 (33.9) (34.3) (30.5) (38.5) (40.5) 27.8 5.8 17.6 23.8 36.7 (9.7) (2.0) (6.2) (8.3) (12.8) 18.1 3.8 11.4 15.5 23.9 54.9 54.9 54.9 54.9 54.9 $0.33 $0.07 $0.21 $0.28 $0.44 2012 2013 2014 2015 2016 47.5 69 89.7 88.4 95 89.7 33.4 170.6 250.2 359.4 780.2 70. 7 31.1 170.8 243.2 359.4 773.4 6 9.3 29.5 188.5 307.1 359.4 855 75.3 32.6 196.3 348.4 359.4 904. 1 86.2 36.6 217.8 347.8 359.4 9 25 Accounts Receivable Inventory Total Current Assets Net Property, Plant & Equip. Goodwill & Intangibles Total Assets Liabilities & Stockholders' Equity Accounts Payable Accrued Compensation Total Current Liabilities Long-term Debt Total Liabilities Stockholders' Equity Total Liabilities & Stockholders' Equity Statement of Cash Flows Net Income Depreciation & Amortization Chg. in Accounts Receivable 40.- 20.1 5.8 25.9 499.4 525.3 254.9 780.2 19.5 5.4 24.9 499.4 524.3 249.1 773.41 2013 3.8 26.8 19 21.9 27.1 31.1 6.1 7.4 9.4 28 34.5 40.5 575.5 601.9 601.9 603.5 636.4 642.4 251.5 267.7 282.6 855 904.1 925 2014 2015 2016 11.4 15.5 23.9 34 39 40.1 1.4|(6.0) (10.9) 2012 18.1 28.7 3.9 20. 1 Chg. in Inventory Chg. in Pay. & Accrued Comp. Cash from Operations Capital Expenditures Cash from Investing Activ. Dividends Paid Sale (or purchase) of stock Debt Issuance (Pay Down) Cash from Financing Activ. Change in Cash Mydeco Stock Price (2.9) 2.3 1.6 (3.1) (4.0) 2.1 (1.0) 3.1 6.5 6 49.9 50.9 51.5 51.9 55.1 (24.0) (23.5) (101.0) (73.7) (41.2) (24.0) (23.5) (101.0) (73.7) (41.2) (5.9) (5.9) [(5.9) (5.9) ((7.3) (5.9) | $8.16 (5.9) 20 21.5 $2.33 76.1 26.4 - 70. 2 2 0.5 (7.3) 20.7(1.3) 6 $5.52 $9.55 $9.53 .6