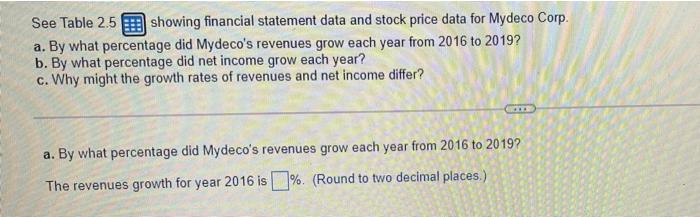
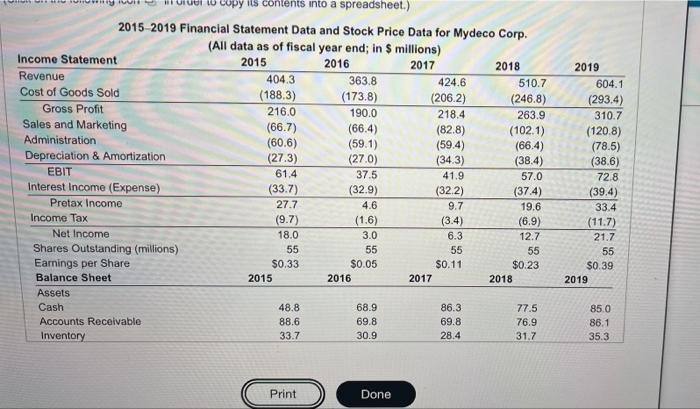
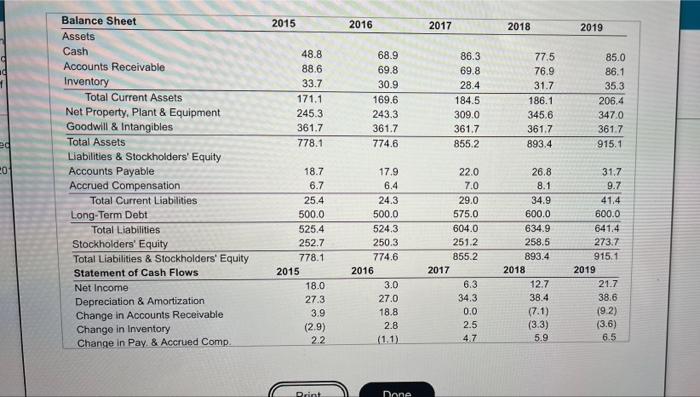
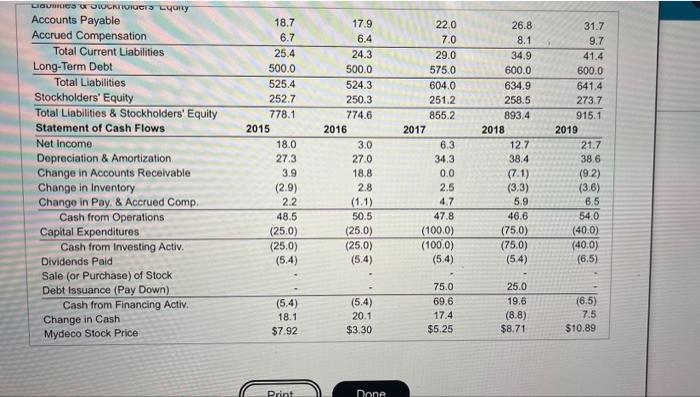
See Table 2.5 showing financial statement data and stock price data for Mydeco Corp. a. By what percentage did Mydeco's revenues grow each year from 2016 to 2019? b. By what percentage did net income grow each year? c. Why might the growth rates of revenues and net income differ? a. By what percentage did Mydeco's revenues grow each year from 2016 to 2019? The revenues growth for year 2016 is %. (Round to two decimal places.) copy its contents into a spreadsheet.) 2015 2019 Financial Statement Data and Stock Price Data for Mydeco Corp. (All data as of fiscal year end; in $ millions) Income Statement 2015 2016 2017 2018 Revenue 404.3 363.8 424.6 510.7 Cost of Goods Sold (188.3) (173.8) (2062) (246.8) Gross Profit 216.0 190.0 218.4 263.9 Sales and Marketing (66.7) (66.4) (82.8) (102.1) Administration (60.6) (59.1) (59.4) (66.4) Depreciation & Amortization (27.3) (27.0) (343) (38.4) EBIT 61.4 37.5 41.9 57.0 Interest Income (Expense) (33.7) (32.9) (322) (37.4) Pretax Income 27.7 4.6 9.7 19.6 Income Tax (9.7) (1.6) (3.4) (6.9) Net Income 18.0 3.0 6.3 12.7 Shares Outstanding (millions) 55 55 55 55 Earnings per Share $0.33 $0.05 $0.11 $0.23 Balance Sheet 2015 2016 2017 2018 Assets Cash 48.8 68.9 86.3 77.5 Accounts Receivable 88.6 69.8 69.8 76.9 Inventory 33.7 30.9 28.4 31.7 2019 604.1 (293.4) 310.7 (120.8) (78.5) (38.6) 728 (39.4) 33.4 (11.7) 21.7 55 $0.39 2019 85.0 86.1 35.3 Print Done 2015 2016 2017 2018 2019 48.8 88.6 33.7 171.1 245.3 361.7 778.1 68.9 69.8 30.9 169.6 243.3 361.7 774.6 86.3 69.8 28.4 184.5 309.0 361.7 855.2 77.5 76.9 31.7 186.1 345.6 361.7 893.4 85.0 86.1 35.3 206.4 347.0 361.7 915.1 ed 20 Balance Sheet Assets Cash Accounts Receivable Inventory Total Current Assets Net Property. Plant & Equipment Goodwill & Intangibles Total Assets Liabilities & Stockholders' Equity Accounts Payable Accrued Compensation Total Current Liabilities Long-Term Debt Total Liabilities Stockholders' Equity Total Liabilities & Stockholders' Equity Statement of Cash Flows Net Income Depreciation & Amortization Change in Accounts Receivable Change in Inventory Change in Pay & Accrued Comp. 18.7 6.7 25.4 500.0 525.4 252.7 778.1 2015 18.0 27.3 3.9 (2.9) 2.2 17.9 6.4 24.3 500.0 524.3 250.3 774.6 2016 3.0 27.0 18.8 2.8 (1.1) 22.0 7.0 29.0 575.0 604.0 251.2 855.2 2017 6.3 34.3 0.0 2.5 26.8 8.1 34.9 600.0 634.9 258.5 893.4 31.7 9.7 41,4 600.0 641.4 273.7 9151 2019 21.7 38.6 (92) (3.6) 6.5 2018 12.7 38.4 (7.1) (3.3) 5.9 47 Print Done 26.8 8.1 34.9 600.0 634.9 258.5 893.4 2018 y Accounts Payable Accrued Compensation Total Current Liabilities Long-Term Debt Total Liabilities Stockholders' Equity Total Liabilities & Stockholders' Equity Statement of Cash Flows Net Income Depreciation & Amortization Change in Accounts Receivable Change in Inventory Change in Pay & Accrued Comp. Cash from Operations Capital Expenditures Cash from Investing Activ. Dividends Paid Sale (or Purchase) of Stock Debt Issuance (Pay Down) Cash from Financing Activ. Change in Cash Mydeco Stock Price 18.7 6.7 25.4 500.0 525.4 252.7 778.1 2015 18.0 27.3 3.9 (2.9) 22 48.5 (25.0) (25.0) (5.4) 179 6.4 24.3 500.0 524.3 250.3 774.6 2016 3.0 27.0 18.8 2.8 (1.1) 50.5 22.0 7.0 29.0 575.0 604.0 251.2 855.2 2017 6.3 34.3 0.0 2.5 4.7 47.8 (1000) (1000) (5.4) 12.7 31.7 9.7 41.4 600.0 641.4 273.7 915.1 2019 21.7 38.6 (9.2) (3.6) 6,5 54.0 (400) (400) (6.5) 38.4 (7.1) (3.3) 5.9 46.6 (750) (750) (5.4) (25.0) (5.4) (6.5) (5.4) 18.1 $7.92 (5.4) 20.1 $3.30 75.0 69.6 17.4 $5.25 25.0 19.6 (8.8) $8.71 7.5 $10.89 Print Done